Download
1 / 38
420 likes | 751 Views
RATP. 2008. RATP in its environment. 01. RATP in its environment: Ile-de-France: the capital region. 01.1. Outskirts. Inskirts. High population density : 18% of France ’ s population on only 2.2% of its mainland territory

E N D
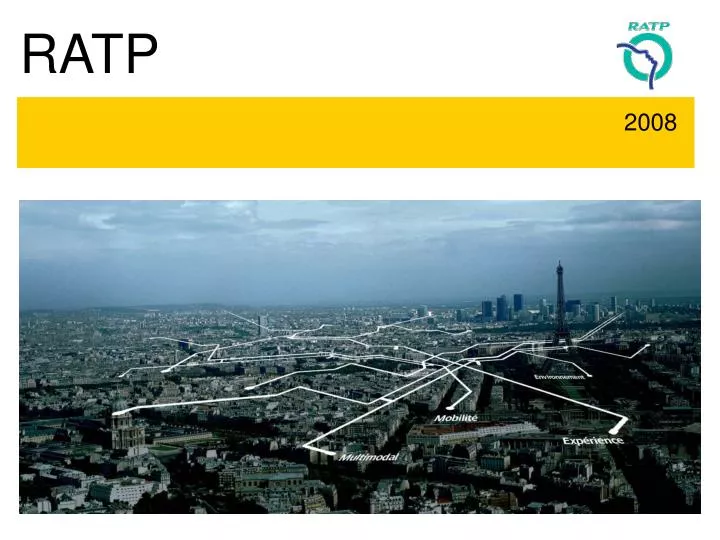
RATP 2008
RATP in its environment:Ile-de-France: the capital region 01.1 Outskirts Inskirts • High population density: • 18% of France’s population on only 2.2% of its mainland territory • 11 million inhabitants (+10 % in 25 years) with faster growth on the agglomeration’s outskirts
RATP in its environment:Ile-de-France: 7 counties 01.2 Superficy 12 000km2 28% of GDP 20% of jobs 11 000 000 inhabitants 19% of French population
RATP in its environment:Ile-de-France: the capital region 01.3 • A region that is particularly rich and dynamic: Accounting for 28% of France’s GDP and 20% of all jobs • A region with great economic contrasts: Uneven development, on both sides of a NW/SE axis • A region that attracts tourists: 44 million visitors a year
11,00 10,50 RATP traffic : journeys on week-end and working days 10,00 9,50 en millions de voyages 9,00 8,50 8,00 week-end 7,50 wd 7,00 janv-97 janv-98 janv-99 janv-00 janv-01 janv-02 janv-03 janv-04 janv-05 janv-06 janv-07 janv-08 RATP in its environmentConstant changes in the public transportation market 01.4 • Significant changes in mechanised travel: • From 17.5 million travels/day in 1976 to 23 million in 2001 (+ 24%) • Greater diversification in people’s reasons for travelling
RATP in its environment public transportation vs use of individual cars 01.5 • Public transportation is involved in 30 % of all journeys. • A sharp rise in car journeys (+ 58% in 30 years)
Paris - Suburbs 4 millions (17 %) Paris - Paris 3 millions (13%) Public Transportation Suburbs- Suburbs Individual cars 16 millions (70 %) Other modes - 8% Evolution 1976-2001 RATP in its environment A different breakdown in Paris / its suburbs 01.6 8% 28% 64% - 8% +5% 3% 37% 60% 3% 16% 81% +50%
RATP in its environment3 operators 4 modes 01.7 • RATP: Ile-de-France’s leading operator (2.9 Bln journeys / year) on a competing market • Running a multimodal transportation network RATP SNCF OPTILE Market share for different public transportation operators Metro Bus, suburbs Bus, in Paris RER RATP, breakdown by mode of transportation
RATP in its environment:Public transportation is organised in a regulated manner 01.8 STIF is the Ile-de-France transit authority.Three missions: organise, modernise and forecast A Board of Directors comprised of29 local authority representativesand presided over by the President of the RegionalCouncil- Each operator is bound to STIF by a contractShared responsibilities and shared risksDuration: 4 years (2008-2011)Any service modifications are covered by contract amendments
RATP in its environment:Contract with the STIF (2008 – 2011) 01.9 • Modalities of application: • RATP is committed to provide transportation services. • RATP makes annual service provision and quality commitments. • Remuneration based on the journeys’ economic value, assessed at their real cost of production. • The level and quality of the service provision is determined throughqualitative objectives. • A bonus - or penalty- incentive system based on 49 indicators. • RATP is fully liable for any changes in its expenditures.
RATP in its environment:Contract with the STIF (2008 – 2011) 01.10 • RATP takes partial responsibility for traffic volume-related commercial risks 10 % RATP 90 % STIF Traffic income above objectives 50 % RATP 50 % STIF Contractual objectives = Traffic income provision. Evolution of traffic volume : + 1,9% in 2008 + 1,5% every year from 2009 Euros + 3 % - 3 % TI 50 % RATP 50 % STIF 10 % RATP 90 % STIF Traffic income under objectives 2008 2009 2010 2011
4,0% 3,0% 6,7% 2,7% 13,9% 41,6% 49,3% 41,6% 37,2% Fares Local companies RATP SNCF Regional & local authorities State OPTILE Special operations Investment RATP in its environment: Financing public transportation in Ile de France 01.4 2008 budget : 7.4 Bln Euros Income Outcome
RATP, the CompanyA national public service company 02.1 • A company created in 1949 • Managing one of the world’s largest multimodal network • Aiming to offer the general public the best service at the best cost • A State-owned national company • The State as its sole shareholder • CEO appointed for 5 years and a 27-member Board
RATP, the CompanyA national public service company 02.2 Variations in turnover in € billion • 2007 results were up • € 3.907 billion in turnover • € 933 million in investments • € 564 million in gross operating profits • € 84 million in net earnings • Traffic in 2007: +0.3 % • 2 873 million of journeys • 44,500 employees Variations in traffic in billion
An integrated multimodal transportation networkMetro: density, frequency, reliability 03.1 The Metro in figures • 14 lines inc. 1 automatic • 10 000 employeesinc. 2 200 drivers • 1.4 billion travellers per annum • 213 km of lines • 381 stations • A very dense network • Rising frequency of use • Constant search for modernisation, via highly innovative plans.
An integrated multimodal transportation network RER: Regional Express Network 03.2 The RER in figures • Performance revolving around transit speed and capacities • Strong rise in frequency of use • Regional network fulfilling a structuring role in the municipalities it serves • The network is almost saturated • 452 million journeys a year • 3 200 employees inc. 780 drivers • 67 stations • 115 km of lines • 120 second intervals between trains
An integrated multimodal transportation networkSurface network (Bus & Tram): efficiency / local services 03.3 The surface network in figures • A dense network of buses and trams • Integrated into the cityscape • Serving every part of Ile-de-France • Flexible adaptation to specific needs (disabled, corporate, night services) • 330 bus routes • 3 tram lines • 15,000 employees (12,000 drivers) • 4,000 vehicles • 7,200 bus & tram stops • 997 million travellers / year
Enhancing performancethrough engineering and maintenance: Rolling stock 04.1 The fleet in figures 3,550 carriages • Maintaining a large multimodal fleet of buses, metros, RERs trains and trams • Technical choices based on an environmentalresponsibility logic: clean buses 1,133 carriages 4,000 vehicles 284 trams • 5,900 employees • 22 bus maintenance workshops • 23 train maintenance workshops
Enhancing performancethrough engineering and maintenance:Spaces and assets 04.2 The fleet in figures • 213 kms of lines • 381 stations • 504 escalators • 443 ticket vending machines • Spaces: • Ensuring that the infrastructure functions properly. Rapid intervention thanks to an organisation • with a frontline presence • Ensuring clean premises and customer hospitality • 115 kms of lines • 67 stations • 294 escalators • 216 ticket vending machines • 330 regular routes • 21 bus depots • 3 bus relays
Enhancing performancethrough engineering and maintenance:Know-how through integrated engineering 04.3 • Recognised know-how, based on: • A project management culture: L14, T3, Ouragan, automatisation of L1, contactless ticketing… • Research and innovation. • The ability to provide assistance, consulting and expertise
Providing quality servicesA range of travelcards 05.1 • Travelcards fitting passengers’ needs and expectations • Long-term subscriptions: • For youngers, schoolchildren or students: Imagine R • For commuters or frequent passengers: Pass Intégrale or Pass Navigo (1 week or 1 month subscription) • For tourists and occasional users: Paris Visite or Mobilis • An innovative technology : The Pass Navigo system
An innovative technology that facilitates ticket use:The Passe Navigo system 05.2
Providing quality servicesReal-time traffic information 05.4 • Information during normal situations: • Real-time information: SIEL on-line info system, on-board vehicle info systems, announcements • Information that can be consulted remotely: Telephone, information centre, Intranet site, etc. • Information on traffic disturbances: • Announcements, visual displays, directions and information provided by customer service personnel • RATP website • Communicating forecasts when traffic disturbances are expected
Providing quality services:An integrated system for a better traffic information 05.5 SIEL Tram SIEL métro SIEL RER At bus stop Inside bus or Tram SIEL Bus
Ile-de-France development prospects, staying in tune: Development opportunities 06.2 • The Ile-de-France Masterplan: RATP is actively involved with State and Region authorities: • Initial study and presentation of projects that will probably come to execution in 20-25 years • The 2006-2010 State-Region Planning Contract: A developmentdynamic involving: • 21 projects and 3 multimodal hubs for RATP • 100 km of new infrastructures, inc. 68 km of tramlines • € 2.8 billion investment in addition to outlays on rolling stock
TW St Denis/Epinay/Villetaneuse Tw St Denis/Sarcelles T1 St Denis/AGIII 75 km # M13 à AGIII T2 la Défense/ Pt de bezons M12 à Mairie d’Aubervilliers T1 Bobigny/Noisy-le-Sec T1 Noisy-le-Sec/Montreuil-VdF Pôle Nanterre Université m 12 km T3 Pôle Noisy-le-Grand B 20 km T2 à Paris TVM Est St Maur/Champigny M4 à Bagneux TCSP RN305 M8 Créteil /Parc des Sports TVM Ouest à Croix de Berny Tw Châtillon/Vélizy/Viroflay TCSP Pompadour/Sucy-Bonneuil Tw Villejuif/Athis-Mons Pôle Massy-Palaiseau NEW INFRASTRUCTURES 2006-2010
RATP. The Group:A development dynamic in France and abroad 07
RATP. The Group:A development dynamic in France and abroad 07.1 • In France • As an operator: Annemasse, Argenteuil, Chelles, Mulhouse, St Quentin-en-Yvelines • Operational assistance: Clermont-Ferrand • Abroad • As an operator :Casablanca (Marocco), Firenze (Tramline), Rhineland-Pfalz (Germany), Railway line Johannesbourg-Pretoria (South Africa), metro line 4 in Sao Paolo, metro in Algiers, Trinidad & Tobaggo. • Operational assistance: Rome