Download

1 / 41
410 likes | 622 Views
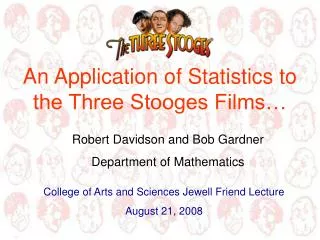
An Application of Statistics to the Three Stooges Films. Robert Davidson and Bob Gardner Department of Mathematics East Tennessee State University. Online at: http://www.etsu.edu/math/gardner/stooges/stooges-statistics-In-Class.htm. A Brief History of the Three Stooges.

E N D
An Application of Statistics to the Three Stooges Films Robert Davidson and Bob Gardner Department of Mathematics East Tennessee State University Online at: http://www.etsu.edu/math/gardner/stooges/stooges-statistics-In-Class.htm
The Six Three Stooges Curly Howard Larry Fine Moe Howard Shemp Howard Joe Besser Joe DeRita
The Three Stooges • As a group, in show business for almost 50 years. • Made 190 “shorts” with Columbia Pictures. • Had their third short, Men in Black (1934), nominated for an Academy Award. • Had 4 different people in the role of “the third Stooge.” • Were the first to lampoon Adolph Hitler, in You Nazty Spy (1940).
Opening slide for the early Three Stooges films Larry, Moe and Curly: 97 shorts between 1934 and 1947. THIS WILL BE ONE OF THE POPULATIONS FROM WHICH WE SAMPLE!!! From: http://www.idivimage.com/files/jwfzehyj2mmummdwn4mr.jpg
Opening slide for the Three Stooges films from the Shemp era Shemp, Larry, and Moe: 77 shorts between 1947 and 1956. THIS WILL BE ONE OF THE POPULATIONS FROM WHICH WE SAMPLE!!! From: http://www.a-1video.com/talking.htm
Larry, Joe, and Moe in Fifi Blows Her Top (1958) Larry, Moe, and Joe: 16 shorts between 1957 and 1959. THIS WILL BE ONE OF THE POPULATIONS FROM WHICH WE SAMPLE!!! From The Three Stooges Scrapbook.
An advertisement from the 1947 Johnson City Press-Times (Tennessee) for a personal appearance by the Three Stooges on October 25, 1947.
The Nature of Statistics • In a nutshell, the nature of a statistical test is: • to hypothesize a certain relationship within a population or between two or more populations, • to take a random sample from the population(s), and • to calculate the probability of the random sample(s) being drawn when the hypothesis is assumed to be true. The desired outcome is to get the probability from (3) which is small. In this event, the hypothesis is rejected in favor of its alternative.
From: http://www.threestooges.net/ “To [Joe] Besser’s eternal shame, he had it written into his contract that he would not be subject to slapping or bodily harm.” “Pure Slap Shtick” by Richard von Busack, Metro Santa Cruz, January 16-22, 1997. Available online at: http://www.ratical.org/ratville/3stooges75yrs.html
“Moe and Larry – they were the best. I enjoyed every minute of it with them. In fact, to show you how wonderful they were, I never liked to be hit with anything. And Larry used to say to me ‘don’t worry Joe, I’ll take it.’ Now that’s the kind of guys they were.” From Stooges: The Men Behind the Mayhem, (DVD) Mackinac Media, 2004.
The null hypothesis is: H0: "The average number of violent acts by Moe against Curly per episode is the same as the average number of violent acts by Moe against Joe." The alternative hypothesis is: Ha: "The average number of violent acts by Moe against Curly per episode is greater than the average number of violent acts by Moe against Joe."
Since we suspect that the average for Curly is greater than the average for Joe, we perform a one-tailed test.
From:http://www.dvdbeaver.com/film2/DVDReviews33/3_stooges_collection_vol._1.htmFrom:http://www.dvdbeaver.com/film2/DVDReviews33/3_stooges_collection_vol._1.htm From:http://lunkhead.net/stoogepics/mls/stoogepics2.html We have no (stated) reason to suspect that there is a difference between the amount of Moe-instituted violence towards Curly versus the amount of Moe-instituted violence towards Shemp. For the sake of illustration, we test a null hypothesis concerning this.
Since we have no reason to suspect a difference between the amount of violence from Moe to Curly or from Moe to Shemp, we test for a difference and perform a two-tailed test. This gives the following null and alternative hypotheses: H0: "The average number of violent acts by Moe against Curly per episode is the same as the average number of violent acts by Moe against Shemp." Ha: "The average number of violent acts by Moe against Curly per episode is different than the average number of violent acts by Moe against Shemp."
Since we have no reason to suspect a difference between the amount of violence from Moe to Curly or from Moe to Shemp, we test for a difference and perform a two-tailed test.
Five RANDOMLY selected Shemp episodes and five RANDOMLY selected Curly episodes were chosen. The number of acts of violence by Moe to these Stooges is as follows: Shemp Curly Episode (episode #) # of acts Episode (episode #) # of acts Average: x1 = 13.2 Average: x2 = 9.6
The sample standard deviation, s, of a sample of size n is: This yields the following sample standard deviations and variances from our data: Shemp s1 = 4.9670 s12 = 24.7 Curly s2 = 2.3022 s22 = 5.3
The two sample t-test assumes that samples are taken from a normal distribution. Given the means and standard deviations of our samples, this is a reasonable assumption. The t statistic for this data is calculated as: From the above data, we have: t = 1.470
Since we have no reason to suspect a difference between the amount of violence from Moe to Curly or from Moe to Shemp, we test for a difference and perform a two-tailed test with t = 1.470.
Excel gives a p-value for this data of: p = 0.1920. This means that we could reject the null hypothesis, but only with confidence (1- p) x 100% = 80.80%.
Conclusion? A level of confidence of 81% is generally considered insufficient (with the “industry standard” level of confidence set at a minimum of 95%). This means that we should fail to reject the null hypothesis that the means are the same. This does not mean that we accept the null hypothesis, but that we find the data insufficient to give a conclusive decision. From: http://www.nndb.com/people/972/000047831/
Five RANDOMLY selected Curly episodes and five RANDOMLY selected Joe episodes were chosen. The number of acts of violence by Moe to these Stooges is as follows: Curly Joe Episode (episode #) # of acts Episode (episode #) # of acts The plus signs (+) indicate that the data for these episodes are incomplete. You will complete these data sets soon.
We now watch 3 to 5 minute segments of some of the randomly chosen shorts to fill in the missing data. We want to count every act of violence of Moe towards Curly, and Moe towards Joe. Joe Moe Curly
A Bird in the Head Columbia short number 89, costarring Curly. This short is classic Stooges and has the boys wallpapering a room. Sock-A-Bye Baby Columbia short number 66, costarring Curly. A baby is abandoned on the Stooges’ doorstep, and they prepare a meal and diaper change. Space Ship Sappy Columbia short number 178, costarring Joe. The Stooges act as “sailors” on a spaceship to Venus.
We now use Excel to compute the mean, variance, t-statistic, and p-value for our collected data.
Our data yields a p-value of: 0.00xx Therefore, we reject the null hypothesis: H0: "The average number of violent acts by Moe against Curly per episode is the same as the average number of violent acts by Moe against Joe" And accept the alternative hypothesis Ha: "The average number of violent acts by Moe against Curly per episode is greater than the average number of violent acts by Moe against Joe." With confidence (1-p) x 100% = 99.xx%
Nice! Why, Soitenly! From:http://www.viewimages.com/Search.aspx?mid=51309234&epmid=3&partner=Google
Possible Problems • What counts as an act of violence? • Sample size? • Data is normally distributed? • Episodes are independent? • Lengths of films are all the same? • Other?
References • Fleming, Michael. The Three Stooges-An Illustrated History. New York: Broadway Books, 1999. • Forrester, Jeff and Forrester, Tom. The Three Stooges: The Triumphs and Tragedies of The Most Popular Comedy Team of All Time. Los Angeles: Donaldson Books, 2005. • Howard, Moe. Moe Howard & The 3 Stooges. Secaucus, NJ:Citadel Press, 1977. • Lenburg, J., Maurer, J.H., and Lenburg, G. The Three Stooges Scrapbook. Citadel Press, 1983. • Morian, Don. “The Three Stooges in ‘Academe’: A Summary/Review of Resent Research.” Presented at the Annual Joint Meetings of the Popular Culture Association/American Culture Association, Philadelphia, PA, April 12-15, 1995. Available online at: http://www.eric.ed.gov/ERICDocs/data/ericdocs2sql/content_storage_01/0000019b/80/13/ef/e6.pdf
Please fill out a questionaire! From:http://www.lunkhead.net/ Thank You!
Five randomly selected Curly episodes and five randomly selected Joe episodes were chosen. The number of acts of violence by Moe to these Stooges is as follows: Shemp Joe Episode (episode #) # of acts Episode (episode #) # of acts Average: x1 = 13.2 Average: x2 = 3.6
The sample standard deviation, s, of a sample of size n is: This yields the following sample standard deviations and variances from our data: Shemp s1 = 4.9670 s12 = 24.7 Joe s2 = 0.8944 s22 = 0.8
The two sample t-test assumes that samples are taken from a normal distribution. Given the means and standard deviations of our samples, this is a reasonable assumption. The t statistic for this data is calculated as: From the above data, Excel gives: t = 4.251
Excel give a p-value for this data of: p = 0.0066. And so we can reject the null hypothesis with a confidence of (1- p) x 100% = 99.34%.