Download
1 / 28
280 likes | 495 Views
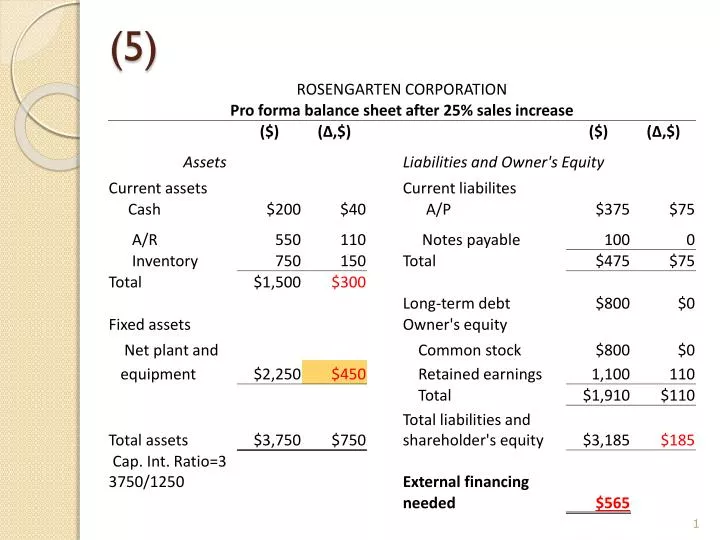
(5). EFN and Capacity Usage (overhead 27). Suppose Rosengarten is operating at 80% capacity: 1. sales at full capacity 1000/.8=1250 2. What is the capital intensity ratio at full capacity? 3300/1250 =2.64 3. What is EFN? 300-185=115 565-450=115

E N D
EFN and Capacity Usage (overhead 27) • Suppose Rosengarten is operating at 80% capacity: 1. sales at full capacity 1000/.8=1250 2. What is the capital intensity ratio at full capacity? 3300/1250 =2.64 3. What is EFN? 300-185=115 565-450=115 Conclusion: excess capacity reduces the need for external financing and capital intensity ratio
EFN and Capacity Usage (Homework) • Suppose Rosengarten is operating at 86.95% capacity: 1. What would be sales at full capacity? 2. What is the capital intensity ratio at full capacity? 3. What is EFN (sales increase 25%)?
EFN and Capacity Usage (Homework) • Full capacity=1000/.8695=1,150 • Cap. Int. Ratio at full capacity: CA for full capacity sales 1,150 (15% increase) = 1,200*1.15=1,380 add 1800 FATA=3,180 and divide by 1,150 sales =2.76 • Addition to FA needed to increase sales to 1250: (1800/1150)*100=156.52 • EFN = 115 +156.52=271.52
Arithmetic and Geometric Mean • Stock Prices as follows P0= 12.4; P1= 13.2; P3= 14.35; P4= 17.4; P5= 11.9; Dividends = .2; .35; .40, .50; • Calculate average return (arithmetic and geometric) • Calculate variance and std
Chapter 12 Some Lessons from Capital Market Historyhttp://www.efinancialcareers-canada.com/ http://www.global-derivatives.com/index.php?option=com_content&task=view&id=54&Itemid=36
Chapter Overview • Return of an investment: arithmetic and geometric • The variability of returns • Efficiency of capital markets
Return from a Security (1) • Dollar return vs. percentage return • Two sources of return • dividend income • capital gain (loss) • realized or unrealized Capital Gain Dividend Yield
Mean • Assume the distribution is normal • Mean return - the most likely return • A measure of centrality • Best estimator of future expected returns
The First Lesson • The difference between T-bills and other investment classes can be interpreted as a measure of the excess return on the risky asset Risk premium = the excess return required from an investment in a risky asset over a risk-free investment
Arithmetic vs. Geometric Averages (1) • Geometric return = the average compound return earned per year over multiyear period • Arithmetic average return = the return earned in an average (typical) year over a multiyear period Geometric average return =
Arithmetic vs. Geometric Averages (2) • The geometric average tells what an investor has earned per year on average, compounded annually. • The geometric average is smaller than the arithmetic (exception: 0 variability in returns) • Geom. average ≈ arithmetic average – Var/2
Which Average to Use? • Geometric mean is appropriate for making investment statements about past performance and for estimating returns over more than 1 period • Arithmetic mean is appropriate for making investment statements in a forward-looking context and for estimating average return over 1 period horizon
The Variability of Returns • Variance = the average squared deviation between the actual return and the average return • Standard deviation = the positive square root of the variance
Standard Deviation • Measure of dispersion of the returns’ distribution • Used as a measure of risk • Can be more easily interpreted than the variance because the standard deviation is expressed in the same units as observations
The Normal Distribution (1) • A symmetric, bell-shaped frequency distribution • Can be completely described by the mean and standard deviation
Z-score • For any normal random variable: • Z – z-score • X – normal random variable • - mean • http://www.mathsisfun.com/data/standard-normal-distribution-table.html
Yet Another Measure of Risk • How much can a bank lose during one year? • Usually reported at 5% or 1% level VaR = statistical measure of maximum loss used by banks and other financial institutions to manage risk exposures
The Second Lesson • The greater the potential reward the greater the risk • Which types of securities have higher potential reward?
Capital Market Efficiency • Efficient capital market - market in which security prices reflect available information • Efficient market hypothesis - the hypothesis that actual capital markets are efficient
What assumptions imply efficient capital market? • Large number of profit-maximizing participants analyze and value securities • New information about the securities come in random fashion • Profit-maximizing investors adjust security price rapidly to reflect the effect of new information
Forms of Market Efficiency • Weak form – the current price of a stock reflects its own past prices • Semistrong form – all public information is reflected in stock price • Strong form – all information (private and public) is reflected in stock prices
Weak Form Efficiency • Current stock price reflects all security market information • You should gain little from the use of any trading rule that decides whether to buy/sell security based on the passed security market data • Major markets (TSX, NYSE, NASDAQ) are at least weak form efficient • January effect
Semistrong Form Efficiency • Mutual fund managers have no special ability to beat the market • Event studies (IPO, stock splits) support the semistrong hypothesis • Quarterly earnings surprise – test results indicate abnormal returns during 13-26 weeks following the announcement of large unanticipated earnings change (earnings surprise) in a company
Strong Form Efficiency • No group of investors has access to private information that will allow them to consistently experience above average profits • Evidence shows that corporate insiders and stock exchange specialists are able to derive above-average profits