Download
1 / 61
610 likes | 811 Views
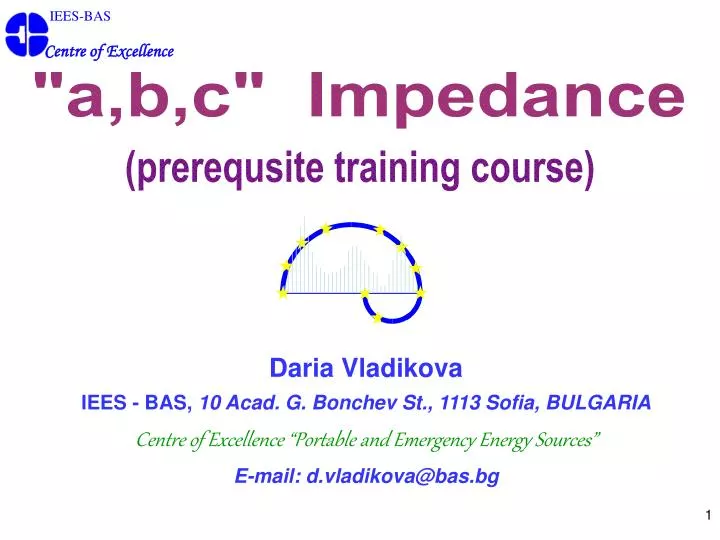
IEES-BAS. Centre of Excellence. "a,b,c" Impedance. (prerequsite training course). Daria Vladikova IEES - BAS, 10 Acad. G. Bonchev St., 1113 Sofia, BULGARIA Centre of Excellence “Portable and Emergency Energy Sources” E-mail: d.vladikova@bas.bg. IEES-BAS. Centre of Excellence.

E N D
IEES-BAS Centre of Excellence "a,b,c" Impedance (prerequsite training course) Daria Vladikova IEES - BAS, 10 Acad. G. Bonchev St., 1113 Sofia, BULGARIA Centre of Excellence “Portable and Emergency Energy Sources” E-mail: d.vladikova@bas.bg
IEES-BAS Centre of Excellence “a,b,c” Impedance is an introductory course, which aims at giving basic knowledge in the field of electrochemical impedance spectroscopy. The course offers general information concerning: principle of the impedance spectroscopy; basic definitions; structural modelling – main electrical and electrochemical elements and their physical meaning, models of basic electrochemical phenomena. “a,b,c” Impedance can be regarded as a necessary prerequisite for the next group of lectures on advanced impedance techniques (non-stationary and differential impedance analyses). SUMMARY
IEES-BAS Centre of Excellence CONTENTS • Introduction 5 • What is Electrochemical Impedance Spectroscopy 10 • Impedance of Electrochemical Systems 13 • 3.1. Basic Hypotheses 14 • 3.2. Impedance Presentation and Monitoring • 3.3. Advantages and disadvantages of Electrochemical Impedance Spectroscopy 20 • Main Steps in the Classical Impedance Investigation 21 • Impedance Models 24 • 5.1. Impedance Elements 25 • 5.1.1. Lumped Elements 26 • Resistance 26 • Capacitance 28 • Inductance 30 • 5.1.2. Frequency Dependent Elements 32 • Warburg Element 32
IEES-BAS Centre of Excellence Bounded Constant Phase Element 42 5.2. Simple Calculations 46 5.3. Basic Electrochemical elements 50 5.3.1. Main Structures of the Electrochemical Models 50 5.3.2. Model Description Conventions 52 5.3.3. Models without Diffusion Limitations 53 Ideally Polarizable Electrode 53 Modified Ideally Polarizable Electrode 54 Polarizable Electrode 55 Modified Polarizable Electrode 58 Faradaic Reaction with One Adsorbed Species 59 5.3.4. Models with Diffusion Limitations 60 Randles Model 60 Modified Randles model 62 CONTENTS
IEES-BAS Centre of Excellence CHAINS EVENTS Internat. Mycrosymp on EIS (every 3 years) Ist – 1987 - RUSSIA IInd - 1990 - BULGARIA IIIrd - 1993 - BULGARIA IVth – 1996 - POLAND Vth – 1999 - HUNGARY VIth - 2002 - CZECHIA VIIth – 2005 – CZECHIA 2001 Established European Impedance Internet Centre with base organization IEES - BAS 2001 Workshop – ITALY 2002 Workshop – SZECHIA 2003 Sofia Impedance Days Internat. Symp. on EIS (every 3 years) Ist –1989 - FRANCE IInd –1992 - USA IIIrd – 1995 - BELGIUM IVth – 1998 - BRAZIL Vth – 2001 - ITALY VIth – 2004 - USA VIIth – 2007 - FRANCE 1. INTRODUCTION INTERNATIONAL IMPEDANCE LIFE
IEES-BAS Centre of Excellence • COVERS WIDE RANGE OF OBJECTS • UNIQUE POSSIBILITYto separate different steps in the total process under investigation • EASY PERFORMANCEof experiments with accessible digital instrumentation • MATURITYin the software exploitation • EASY PERFORMANCEof VIRTUAL impedance data analysis (e- data analysis) • SERVES & UNITES • a great variety of research & applied areas 1. INTRODUCTION IMPEDANCE OFFERS IMPORTANT ADVANTAGES From SCIENTIFIC point of view From APPLIED point of view
IEES-BAS Centre of Excellence 1. INTRODUCTION BASIC IMPEDANCE LITERATURE ·D. C. Graham, Chem. Rev., 1947, 41, 441. ·P. Delahay, New Instrumental Methods in Electrochemistry, 1965, Wiley-Interscience, New York. ·P. Delahay, Double Layer and Electrode Kinetics, 1965, Wiley-Interscience, New York. ·D. E. Smith, Electroanalytical Chem.1966, 1,1(Eds. A. J. Bard, Marcel Dekker), New York. ·M. Sluyters-Rehbach and J. H. Sluyters in On the impedance of galvanic cell. The potential dependence of the faradaic parameters for electrode processes with coupled homogeneous chemical reactions, Electroanalytical Chem.1970, 4,1(Eds. A. J. Bard, Marcel Dekker), New York. ·J. R. Macdonald in Superionic Conductors, (Eds. G. D. Mahan, W. L. Roth), Plenum Press, New York, 1976, p.81. ·J. R. Macdonald in Electrode Processes in Solid State Ionics, (Eds. M. Kleitz and J. Dupuy), Reidel, Dordrecht, Holland, 1976, p.149. ·M. C. H. McKubre and D. D. Macdonald in A Comprehensive Treatise of Electrochemistry, (Eds. J. O’M Bockris, B. E. Conway and E. Yeager), Plenum Press, New York, 1977. ·D. D. MacDonald, Transient Techiques in Electrochemistry, Plenum Press, New York, 1977. ·R. D. Armstrong, M. F. Bell and A. A. Metcalfe, Electrochem. Chem. Soc. Spec. Rep. 1978, 6, 98. ·W. I. Archer and R. D. Armstrong, Electrochem. Chem. Soc. Spec. Rep. 1980, 7, 157. ·C. Gabrielli, Identification of Electrochemical Process by Freguency Response Analysis, Monograph Reference 004 /83, Solartron Instr.Group, Farnsborough, England, 1980. ·D. D. Macdonald and M. C. H. McKubre, Electrochemical Impedance Technigues in Corrosion Science: Electrochemical Corrosion Testing, STP 272, ASTM, Philadelphia, PA, 1981. ·J. R. Macdonald, IEEE Trans. Electrical Insulation EI-15, 1981, 65. ·D. D. Macdonald and M. C. H. McKubre, Modern Aspects of Electrochemistry, (Eds. J. O’M Bockris, B. E. Conway and R. E. White), Plenum Press, New, 1982, 14, 61. ·M. Sluyters-Rehbach and J. H. Sluyters in Comprehensive Treatise of Electrochemistry, (Eds. E. Yeager, J. O.’M. Bockris, B. E. Conway and S. Sarangapani), Plenum Press, New York, 1984, p. 177.
IEES-BAS Centre of Excellence 1. INTRODUCTION BASIC IMPEDANCE LITERATURE • ·C. Gabrielli, Identification of Electrochemical Processesby Frequency Respose Analysis, Technical Report№ 004, Solartron, Hampshire, 1984.(can be dounloaded from http://accessimpedance.iusi.bas.bg) • J. R. Macdonald (Ed.), Impedance Spectroscopy - Emphasizing Solid Materials and Systems, Wiley-Interscience, New York, 1987. • ·C. Gabrielli, Use and Applications of Electrochemical Impedance Tecniques, Technical Report№ 024, Solartron, Hampshire, 1990. • ·Z. Stoynov, B. Grafov, B. Savova-Stoynova and V. Elkin, Electrochemical Impedance, 1991, Publishing House Science, Moscow (in Russian). • ·D. D. Macdonald in Tecniques for Characterization of Electrodes and Electrochemical Processes, (Eds. H. R. Varma and J. R. Selman, J.Wiley&Sons), New York, 1991, p.515. • ·F. Mansfeld and W. J. Lorenz in Tecniques for Characterization of Electrodes and Electrochemical Processes, (Eds. H. R. Varma and J. R. Selman, J.Wiley&Sons), New York, 1991, p.581. • ·C. M. A. Brett and A. M. Oliveira Brett, Electrochemistry, Principles, Methods and Applications, 1993, Oxford University Press. • ·A. Lasia, Electrochemical Impedance Spectroscopy and Its Applications, Modern Aspects of Electrochemistry, B. E. Conway, J. Bockris, and R. White, Edts., Kluwer Academic/Plenum Publishers, New York, 1999, Vol. 32, p. 143-248. http://www.wkap.nl/prod/b/0-306-45964-7 • ·Second International Symposium on Electrochemical Impedance Spectroscopy, Electrochimica Acta, 38, 14, 1993. • ·Third International Symposium on Electrochemical Impedance Spectroscopy,Electrochimica Acta,41, 7/8, 1996. • ·EIS’98 Proceedings – Impedance Spectroscopy”Electrochimica Acta, 44, 24, 1999. • ·Fifth International Symposium on Electrochemical Impedance Spectroscopy,Electrochimica Acta, 47, 13/14, 2002. • ·R. Cottis and St. Turgoose, Electrochemical Impedance and Noise, Eds. B. C. Syrett, NACE International, 1440, South Greek Drive, Houston, TX77084, 1999.
IEES-BAS Centre of Excellence Sinwave input x( iw) = A sin wt Sinwave output y( iw) = B sin (wt + f) • Principle: • 1. If the system under investigation is LINEAR (LS), • LS is perturbed with sinwave input x(iw)and the response y( iw)is measured; • The responsey( iw) is also sin wave with the same freqiency and different amplitude and phase; • The ratio output / input signal determines the complex transfer coefficient for the correspondingfrequency: • k( iw) = y( iw) / x( iw) 2. WHAT IS ELECTROCHEMICAL IMPEDANCE SPECTROSCOPY The Electrochemical Impedance Spectroscopy is based on the classical method of the TRANSFER FUNCTION (TF) Linear System
IEES-BAS Centre of Excellence Complex number (Re; Im) Depends onwand the object’s properties Linear System Y (iwi) = Sinwave output (w1- wn) X (iwi) = Sinwave input (w1- wn) Principle: 3. If the input is composed by sin wave signals X (iwi) and the outputY (iwi) – by the same set of frequencies (w1- wn), the ratio between the two vectors H(iwi) = Y (iwi) / X (iwi) is the Transfer Function H(iwi) TF describes the frequency dependence of the transfer coeffcient k(wi) 4. The transfer from the time-domain to the frequency domain is performed by LAPLAS transform. For steady state linear systems it is replaced by FOURIER transform 2. WHAT IS ELECTROCHEMICAL IMPEDANCE SPECTROSCOPY k( iw) = y( iw) / x( iw)
IEES-BAS Centre of Excellence Principle: 5. TF is impedance H(iwi) = Z (iwi) when the input signal is current (I) and the output signal is voltage (U) 6. TF is admittance H(iwi) = Y (iwi) = Z-1 (iwi) when the input signal is voltage (U) and the output signal is current (I) 7. When the frequency range (w1- wn)is large and covers all the properties of the system, the system is observable, otherwise S is partially observable. Conclusion: The Transfer FunctionH(iwi) describes totallya linear, steady-state and observable system. 2. WHAT IS ELECTROCHEMICAL IMPEDANCE SPECTSCOPY
IEES-BAS Centre of Excellence Electrochemical systemsbehave as big, non-linear, non-steady state, semi-irreversible systems with distributed parameters in macro-and micro scales. During operation or investigation processes of mass- and energy transfer take place. Obviously the application of the TF approach needs a number of simplifications and assumptions. They are generalized in few BASIC WORKING HYPOTHESES They can be divided in2 groups: 1. Working hypotheses from system analysis point of view 2. Working hypotheses from electrochemical point of view. 3.IMPEDANCE OF ELECTROCHEMICAL SYSTEMS
IEES-BAS Centre of Excellence • 2.1.1. Working hypotheses from system analysis point of view • I. Linearity: This requirement is fulfilled if the input perturbation signal is small enough to keep the state of the investigated system unchanged. The requirement for a small signal covers the potential, the current, as well as the quantity of electricity for half a period (very important at low frequencies!). • Verification of the hypothesis for linearity: the measured impedance should not depend on the amplitude of the signal. • Experimental verification: Consecutive impedance measurements in the full frequency range with decreasing amplitude and analysis of the weighted differences. • Small signal : - depends on the investigated system; in some cases 3-5 mV, in others 50-100 mV 3. 1. Basic Working Hypotheses
IEES-BAS Centre of Excellence 2.1.1. Working hypotheses from system analysis point of view II. Causality: This requirement means that all the changes in the investigated system are caused by the perturbation signal, i.e. the output signal is a result of only the input signal and can not appear if there is no input signal. III. Single input, single output: This requirement could be achieved if the rest of the parameters (temperature, concentration, d.c. signal, pH etc.) are kept constant by passive or active conditioning. IV. Observability: This requirement postulates, that all the phenomena under study can be observed in the measured frequency range. 3. 1. Basic Working Hypotheses
IEES-BAS Centre of Excellence • 2.1.1. Working hypotheses from system analysis point of view • V. Lack of memory effects: This requirement means that the investigated system dos not “remember” the history of the experiment. That means that the result does not depend on the order of the measurements. • This property could be expected form entirely reversible systems. • Experimental verification: Performance of two consecutive impedance measurements - the one with scanning from high to low frequencies and the other – on the opposite – from low towards high frequencies, followed by and analysis of the weighted differences. 3. 1. Basic Working Hypotheses
IEES-BAS Centre of Excellence • 2.1.1. Working hypotheses from electrochmical point of view • Additiveness of the Faradaic current and the charging current of the double layer • Electrical neutralityof the electrolyte – the total density of the charges in every point of the solution is zero • Lack of convection and migration – i.e. there are no changes in the local concentration of the electrolyte • Lack of lateral mass and charge fluxes at the electrode surface. • Conclusion: • The performance of a precise impedance investigation strongly depends on the correctly organized experimental setup, experimental conditions and measuring technique and on the careful preparation of the object. • Some of the electrochemical simplifications help for the construction of the models 3. 1. Basic Working Hypotheses
IEES-BAS Centre of Excellence 3.2.1. Impedance presentation Z (iwi) = Y (iwi) / X (iwi) =U(iwi) / I (iwi) complex number Presentation in Cartesian coordinates: Z (iwi) = Rei + iImi i = (-1)1/2; i = 1, 2 ,….n – denotes the frequency range Nd – frequency density (measured frequencies in one decade; 3-5 for screening; 10-15 for precise measurements; Down scanning – from high to low frequencies Presentation in Polar coordinates: Z (iwi) = =Z Z= (Rei2 + iImi2)1/2- modulus; f i= Arc tan Imi/Rei - phase 3. 2.Impedance Presentation and Monitoring
IEES-BAS Centre of Excellence Bode plots Recalculated 3Dset of data: D3 [ wi, Zi, f i] ; i = 1, 2, ..n Coordinates: xi = lg wi ; y1i = Zi;, y2i = f i Complex plane (Nyquist) plot Experimental 3D set of data: D3 [ Rei, Imi, wi] ; i = 1, 2,..n Coordinates: xi = Re; yi = - Im 3. 2.Impedance Presentation and Monitoring 3.2.1. Impedance monitoring (graphical visualization) The problem of impedance monitoring comes from the3-dimensional nature of the data, which should be plotted in a 2-dimensional pattern. The most common presentations are the complex plane (Nyquist) plot (in Cartesian coordinates) and Bode plots (in polar coordinates).
IEES-BAS Centre of Excellence From one side the impedance (or admittance) functions contain all the information for the investigated system (if the working hypotheses are fulfilled at the selected working point). From another side this information has to be extracted from the data, i.e. the data analysis is an identification procedure. Advantage: The electrochemical impedance has the unique possibilityto separate the kinetics of the different steps involved in the total process under investigation, because as a transfer function it is a local, linear an full description of the system under study. A number of processes are taking place, caused by the perturbation signal. The impedance, however, does not measure them, i.e. it is not a physical reality, but information property of the object. Disadvantage: Since impedance is not a physical reality, the interpretation of the experimental data is based on the construction of a working model, following a preliminary working hypothesis, which should be identified. This introduces a subjective component in the analysis. 3.3. ADVANTAGES AND DIADVANTAGES OF ELECROCHEMICAL IMPEDANCE SPECTROSCOPY
IEES-BAS Centre of Excellence MEASUREMENT D3 [ Rei, Imi, wi] DATA MONITORING 4. MAIN STEPS IN THE CLASSICAL IMPEDANCE INVESTIGATION I STAGE
IEES-BAS 4. MAIN STEPS IN THE CLASSICAL IMPEDANCE INVESTIGATION Centre of Excellence Choice of aHypotheticalModel P = Par.Ident. {wi, Rei, Imi, IM [S] } estimated parameters supposed model Parametric Identification (CNLS) Model Validation 1. Zi= Simulation {M [S,P] I wi, } given 2. Choice of measure for proximity (distance between measured and estimated data) 3. Evaluation of the distance for “Best fit” II STAGE – DATA ANALYSIS Data Analysis will be given in the lectures on the Workshop
IEES-BAS 4. MAIN STEPS IN THE CLASSICAL IMPEDANCE INVESTIGATION - Example Centre of Excellence I. Measurement & Data Monitoring II. Data Analysis • Choice ofHypothetical • models 2. Parametric Identification (CNLS) 3. Models Validation NO C C P(S) =R1, R2, C (estimated values) 1. 1. CPE CPE CPE CPE R1 R1 R1 R1 YES P(S) =R1, R2, C1, R3, C2 2. 2. R2 R2 R2 R2 R R 2 2 R R 1 1 R R 3 3 NO 3. 3. P(S) =R1, R2, CPE C C 1 1 C C 2 2 ( D3 [i, Rei, Imi] )
IEES-BAS Centre of Excellence 5. IMPEDANCE MODELS There are few approaches for presentation of the impedance models. The electrical circuit modelling approachis very convenient for impedance studies of electrical properties. In this case the electrical circuit has a response identical to that obtained from the measurement of the investigated system. The electrical circuit can be regarded as a construction of different electrical and electrochemical elements (structural elements) connected under given laws. If the model is not formal, the values of its elements could give a significant contribution to the physical understanding of the investigated system.
IEES-BAS Centre of Excellence 5.1. IMPEDANCE ELEMENTS • Impedance elements are described with one or more parameters, which determine their dimensions. • Impedance elements can be divided it 2 basic groups: • Lumped elements: resistance R; capacitance C; inductance L. They are directly adopted form electrotechniques, i.e. they are electrical elements and can describe homogeneous systems. • Frequency dependent elements – they describe frequency unhomogeneity. They are developed for descrption of some electrochmical processes, i.e. they are electrochemical elements.
IEES-BAS Centre of Excellence 5.1.1. LUMPED ELEMENTS RESISTANCE R • R is the simplest modelling element • Modelling in the time (t) domain – follows Ohm’s Law: • UR=R.I • (UR - voltage drop; I – current) Dimensions: ohm (Ω) = VA-1 = m2kgA-2s-3
IEES-BAS Centre of Excellence R Impedance diagram in the frequency range 105-10Hz 5.1.1. LUMPED ELEMENTS RESISTANCE R 2. Modelling in the frequency ()domain: ZR (i)=R only real part (Re=R; Im =0) • 3.Physical meaning: • description of: energy losses; dissipation of energy; potential barrier; electronic conductivity or conductivity of very fast carriers • Electrolyte resistance - Zs(i)=Rs - for water based electrolytes • Ohmic resistance - R = Rs + Rm (Rm- R of metallic leads)
IEES-BAS Centre of Excellence • Modelling in the time (t) domain – Capacitance C can be regarded as a proportionality coefficient between the voltage Uc and the integral of the current i running through the capacitance : Dimensions: F = sΩ-1 5.1.1. LUMPED ELEMENTS CAPACITANCE C
IEES-BAS Centre of Excellence 2. Modelling in the frequency ()domain: C only imaginary part (Re = 0) The impedance decreases with the increase of the frequency. Impedance diagram in the frequency range 105-10 Hz C 1 = 1E-4 C 2 = 1E-3 5.1.1. LUMPED ELEMENTS CAPACITANCE C • 3. Physical meaning: • modelling of : mass and charge accumulation, dielectric polarization, integral relation between parameters; • Double layer capacitance Cdl. The impedance of the double layer has a capacitive character.
IEES-BAS Centre of Excellence • Modelling in the time (t) domain – • The Inductance L can be regarded as a proportionality coefficient between the voltage UL and the derivative of the current i: • Dimensions: H = Ωs 5.1.1. LUMPED ELEMENTS INDUCTANCE L
IEES-BAS Centre of Excellence 2. Modelling in the frequency ()domain: . only imaginary part (Re = 0) The impedance increases with the increase of the frequency. Impedance diagram in the frequency range 105-10 Hz L 1 = 1E-4 L 2 = 1E-3 L 5.1.1. LUMPED ELEMENTS INDUCTANCE L • 3. Physical meaning: • Modelling of : self inductance of the connecting cables, the measuring cell and investigated objects, self inductance of current flow or of charge carriers movement; • accumulation of magnetic energy;
IEES-BAS Centre of Excellence • Modelling in the time (t) domain • Warburg element(1896 year)is the first electrochemical element introduced for impedance description oflinear semi-infinite diffusion, which obeys the second Fick’s low: 5.1.2. FREQUENCY DEPENDENT ELEMENTS WARBURG ELEMENT W
IEES-BAS Centre of Excellence 2.Modelling in the frequency()domain: Re = Im - phase shift = 450 and frequency independent W is a proportionality coefficient known as Warburg coeffcient Dimensions: Ωm2s1/2 Impedance diagram in the frequency range 105-10 Hz with W = 100 ohm.s1/2 W 5.1.2. FREQUENCY DEPENDENT ELEMENTS WARBURG ELEMENT W
IEES-BAS Centre of Excellence REMARK:The applied frequencies should ensure conditions at which the sin wave should not reach the end of the diffusion layer. Thus Warburg impedance is a one port element – it has only one input. This property does not allow the introduction of another element after Warburg impedance. 5.1.2. FREQUENCY DEPENDENT ELEMENTS WARBURG ELEMENT W
IEES-BAS Centre of Excellence • Modelling : • CPE represents an empirical relationship; • CPE describes frequency dependent impedance caused by surface roughness or non-uniformly distributed properties of the irregular electrode surface. • A – proportional factor [Ωm-2sn]; • n – exponential coefficient (CPE exponent) corresponding to the phase angle n п/2 5.1.2. FREQUENCY DEPENDENT ELEMENTS CONSTANT PHASE ELEMENT CPE
IEES-BAS Centre of Excellence • 2.CPE is a generalized element . • Its properties depend on the value of n. • for n = 0.5 e ( 0 < e < 0.2) CPE corresponds to diffusion with deviations from the second Fick’s law; • for n = 0 eCPE models distorted resistance( n < 0 is related to inductive energy accumulation); • for n = 1 – eCPE models distorted capacitance; • for n = -1+eCPE gives distorted inductance. CPE Impedance diagram in the frequency range 105-10Hz n= 0.45 n= 0.2 n= 0.8 n= 0.9 5.1.2. FREQUENCY DEPENDENT ELEMENTS CONSTANT PHASE ELEMENT CPE • For integer values of n ( n = 1, 0, -1) CPE models respectively the lumped elements C, R and L.
IEES-BAS Centre of Excellence 5.1.2. FREQUENCY DEPENDENT ELEMENTS CONSTANT PHASE ELEMENT CPE • 3. Physical meaning of CPE. • CPE may have direct physical meaning : • the generalized resistancen = 0 - 0.2 may model conductance of ionic clouds or conductance connected with accumulation of magnetic or electrostatic energy; • the generalized capacitance n = 0.8 - 1 may model surface roughness of the electrode or distribution of the charge carrier density, i.e. a double layer with complicated stricture; • The generalized Warburg n = 0.4 - 0.6 may present non-ideal geometry of the diffusion layer; presence of migration or convection; diffusion connected with energy loses or accumulation of charges; constrains of the host matrix to the diffusion of species,unhomogeneous diffusion; • CPE may be also used for formal better modelling of an external similarity with the measured impedance.
IEES-BAS Centre of Excellence 3. Physical meaning of CPE. REMARK: In general CPE is semi-infinite element. It models the impedance of homogeneous semi-infinite layer, i.e. of a layer with a thickness bigger than the penetration depth of the perturbation signal. Thus the CPE has only an input with the exception in the cases when n = 1, 0, -1 and CPE has the features of lumped elements. 5.1.2. FREQUENCY DEPENDENT ELEMENTS CONSTANT PHASE ELEMENT CPE
IEES-BAS Centre of Excellence In real systems very often at low frequencies the perturbation signal penetrates to the end of the layer, which behaves as a layer with a finite thickness. For more precise modelling of such systems boundedelectrochemical elements are introduced. 5.1.2. FREQUENCY DEPENDENT ELEMENTS BOUNDED ELEMENTS
IEES-BAS Centre of Excellence • Modelling • Bounded Warburg element describes the impedance of a linear diffusion in a homogeneous layer with finite thickness: • R0is the total resistance[Ω] of the layer at w = 0 • At high frequencies ( ) BW behaves as • Warburg element. 5.1.2. FREQUENCY DEPENDENT ELEMENTS BOUNDED WARBURG ELEMENT BW
IEES-BAS Centre of Excellence Impedance diagram in the frequency range 105-10Hz R 0 = 100 R 0 = 200 R 0 = 300 R 0 = 400 W = 0.01 BW 5.1.2. FREQUENCY DEPENDENT ELEMENTS BOUNDED WARBURG ELEMENT BW
IEES-BAS Centre of Excellence • Modelling • BCP represents the impedance of a bounded homogeneous layer with CPE behaviour of the conductivity in the elementary volume and a finite conductivity R0 at d.c. ( ): • n and A are the CPE coefficients. 5.1.2. FREQUENCY DEPENDENT ELEMENTS BOUNDED CONSTANT PHASE ELEMENT BCP
IEES-BAS Centre of Excellence • For high enough frequencies wa BCP tends to the classicalCPE: The error e is small. • For frequencies below a given limit wbthe element displays a behavior of pure resistance R0: • The frequency limitswaandwbare obtained with a relative error 1%: • wa =(2.7A-1R0-1)n-1 • wb =(0.14A-1R0-1)n-1 BCP Impedance diagram in the frequency range 105-10Hz R 0 = 100 R 0 = 200 R 0 = 300 R 0 = 400 n = 0.45 A = 0,01 5.1.2. FREQUENCY DEPENDENT ELEMENTS BOUNDED CONSTANT PHASE ELEMENT BCP 4.Properties of BCP element – the most generalized element
IEES-BAS Centre of Excellence BCP Impedance diagram in the frequency range 105-10Hz R o = 400 A = 0.01 n = 0.3 5.1.2. FREQUENCY DEPENDENT ELEMENTS BOUNDED CONSTANT PHASE ELEMENT BCP 4. Properties of BCP element • criterion for verification of BCP: • ( a and b are the angles of the diagram’s asymptotes respectively at low and high frequencies. b = 2a = (n p/2)
IEES-BAS Centre of Excellence Remark: BCP can be applied for n = 0 – 0.6 because of the initial assumption that the investigatd object is regarded as a conductor. Obviously at higher values for n the system demonstrates capacitive behaviour. 5.1.2. FREQUENCY DEPENDENT ELEMENTS BOUNDED CONSTANT PHASE ELEMENT BCP
IEES-BAS Centre of Excellence • The impedance calculations of the combinations of elements follows some rules: • When the elements are connected in series, their impedance are added to each other: • When the elements are connected inparallel, their admitances, i.e. the reciprocals of the impedance are added : ZIPE (iw) =ZR(iw) + ZC(iw) 1/Z PE(iw) =1/ZR(iw) +1/ ZC(iw) 5.2. SIMPLE CALCULATIONSEXAMPLE ON R AND C ELEMENTS
IEES-BAS Centre of Excellence + Connections between elements: ZR(iw) = R ZC(iw) = -i(wC)-1 Series connection: Parallel connection: R 1/Z(iw) =1/ZR(iw) +1/ ZC(iw) Z(iw) =ZR(iw) + ZC(iw) C R C C R 5.2. SIMPLE CALCULATIONSEXAMPLE ON R AND C ELEMENTS
IEES-BAS Centre of Excellence R C 5.2. SIMPLE CALCULATIONSEXAMPLE ON R AND C ELEMENTS Series connection: Z(iw) =ZR(iw) + ZC(iw) Z (i) = ZR (i) + ZC (i) = R + (iC)-1 = R - i(C)-1
IEES-BAS Centre of Excellence Paralel connection: 1/Z(iw) =1/ZR(iw) +1/ ZC(iw) + Z (i) = + i C Z 5.2. SIMPLE CALCULATIONSEXAMPLE ON R AND C ELEMENTS
IEES-BAS Centre of Excellence • Voigt’s Structure – consists of meshes with impedances Zk (iw), connected in series. The flowing current is equal for all meshes. The phenomena modelled by each mesh start instantaneously. Their rates depend on their own time-constants. R2 R1 C2 C1 Voigt’s model structure is applied for impedance description of solid state samples 5.3.BASIC ELECTROCHEMICAL MODELS5.3.1. MAIN STRUCTURES OF ELECTROCHEMICAL MODELS
IEES-BAS Centre of Excellence • Ladder Structure – consists of a number of kernels corresponding to the modelled phenomena. The modelled phenomena occur consequently. Z(iw) = Z1(iw) + {Z2(iw) + [Z3(iw) + Z4(iw) + …)-1]-1}-1 R1 The model has a typical “ladder”structure 2. Application – description of processes at the electrode interface. R2 C1 C2 5.3. BASIC ELECTROCHEMICAL MODELS5.3.1. MAIN STRUCTURES OF ELECTROCHEMICAL MODELS