Download
1 / 42
420 likes | 561 Views
General Computer Application Knowledge. Is There a Difference Between the Genders?. Laurie J. Patterson, Ed.D. University of North Carolina Wilmington. Background Theories Computer Usage Game Examples Computer Competency Study Class Format Skill Tests Results Surprises?.

E N D
General Computer Application Knowledge Is There a Difference Between the Genders? Laurie J. Patterson, Ed.D. University of North Carolina Wilmington
Background • Theories • Computer Usage • Game Examples • Computer Competency • Study • Class Format • Skill Tests • Results • Surprises?
NCES Statistics • Between 1984 and 1996, there was an increase of girls and boys who used a computer in 8th grade • By 11th grade, the number of boys who used computers increased while the number of girls who used them remained at the same 8th grade level • Between 2000 and 2004, girl usage increased and they were as likely as boys to use computers… however their numbers are still low
Males and Females • Females stop participating in science, math, and engineering • including computer science • Why? • no documentable reason why the number of females enrolled in or remaining in computer courses decreases… @UNCW 50 CS Pre-Majors: 8 female 16% 40 CS Majors: 4 female 10% 30 CS Grads: 5 female 16.6%
Females and Computers • Research suggests that males and females see the world of computers differently • Males conceptualize the idea of how cyberspace is comprised and use the Internet to gather information or ideas to promote themselves • Females view cyberspace as way to collaborate with others and use the Internet for communication • Elementary school: • Both boys and girls show equal mathematics and science interest and abilities • Junior high school: • Fewer girls take mathematics or science courses • Boys are five times more likely to enroll in a computer course • High school: • Girls enroll in very few mathematics or science courses. • Girls who do continue to enroll in mathematics frequently receive less attention from their instructors than boys do.
Theories • Support systems (or lack thereof) • Stereotypes • Hormones • Few role models or mentors • “Too” hard/not fun • Lack of exposure to computers • Different needs/uses of computers
Support Systems BLO
Lack of Exposure • Anxiety • Constantly learning how to do something new • Technology constantly changing • Low confidence levels
Confidence and Use • Inter-correlation between computer confidence and interest in/enjoyment of computers • Males may use computers to gather information or promote themselves • Females may use computers to communicate and collaborate
Computer Use • As young children, boys are already using mathematics concepts with their toys. • Many of their “action toys,” such as sling shots, b-b guns, and video games utilize velocity and angles.
Video Game Usage • Games “may” reinforce gender stereotypes • females need rescuing • females are passive • 70% of game players are male • Action games use mathematical concepts of angles and velocity • “Girl” games pet and walk the dog… or work with fashion andmakeup stereotypes
Pool http://www.youtube.com/watch?v=jx9hrwO7Dd8
Pool http://www.youtube.com/watch?v=23pmcFfF-XI
http://www.nintendo-difference.com/jeu8499-cosmetic-paradise.htmhttp://www.nintendo-difference.com/jeu8499-cosmetic-paradise.htm Cosmetic Paradise
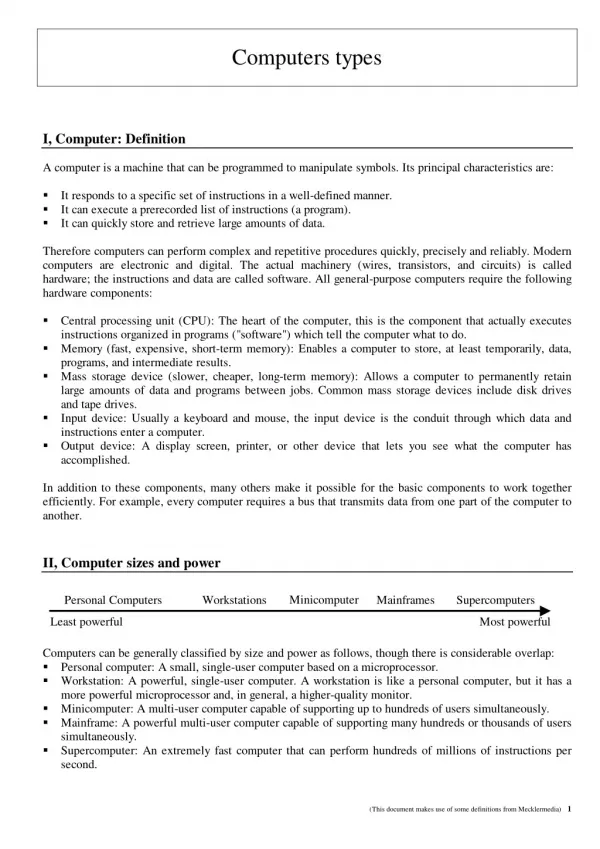
Computer Competency • States have implemented K-12 computer competency requirements • Colleges/Universities have also implemented computer competency requirements
Computer Competency Requirements • UNCW’s computer-competency requirement “The university requires that all students prior to graduation develop competency in basic computer skills including knowledge of campus use policies, facility with standard applications, and awareness of legal and ethical issues. Students in each major must satisfy the requirements in computer competency as specified by that major.”
Study…Fall 2004 • Skill Assessment Software implemented into one of UNCW’s computer competency courses • Assessment software “mimic’d” the look of productivity software and allowed for students to “use” the software • Tested using Word, Excel, PowerPoint, and Access skill assessments
Skill Testing • Fall Semester 2004: • SAM Skill tests were implemented across all sections • Applications used within this course are Microsoft’s productivity applications • SAM mimics the application • Students see what appears to be the application’s interface • Instructions appear at the bottom of the screen • Tests were used by 75 sections of CSC 105 between Fall 2004 and Spring 2007, reaching 2,306 students
Student Assessments • Reached an average of 384 students across an average of 12 sections each semester…averaging 32 students in each section. • Students were allowed to “test out” of the various applications. • To “test out” of the application, students had to receive a 70-80% score in the test.
Student Assessments • Students could also take the test to determine their existing skill level and could work through the training and retake the test as a post-test. • It was not a requirement that students take the pre-test. • Students who did not successfully pass the assessment were required to do several lab exercises that walked them through the many skills and they would then complete a post-test. • Post-tests presented the information using a different scenario.
Assessment Reviews • Comparison of: • each individual’s pre-test to the post-test. These individuals completed lab exercises in the application between the two tests. • post-test scores for those individuals who did not take a pre-test but instead undertook the training. • scores for individuals, by gender, who took the pretest and did no additional work. • scores for individuals who had tested out … to those who had taken the training first and then taken the post-test.
Assessment comparisons • Pretest results compared to the same individual’s post-test results • Pretest ~ Lab work ~ Post test • Post-test scores after working with the application • Lab work ~ Post test • Pretest only scores • Pre test ~ Test out
278 students took the test Posttest Mean (group)82.47 Female mean: 82.27 Male mean: 82.75 AccessPretest ~ Lab work ~ Post test n=162 n=116 • Pretest Mean (group)46.56 • Female mean: 46.43 • Male mean: 46.75 No statistically significant difference between the genders
AccessLab work ~ Post test • Mean (group) 85.08 • Female mean: 85.44 • Male mean: 84.52 473 students took the test n=287 n=186 • tcrit(.05):1.65 • calculated t value: .872245083 No statistically significant difference between the genders
AccessPretest ~ Test out 415 students took the test n=184 n=231 • Mean (group) 76.42 • Female mean: 76.15 • Male mean: 76.69 • tcrit(.05):1.97 • calculated t value: .227773728 No statistically significant difference between the genders
ExcelPretest ~ Lab work ~ Post test 435 students took the test n=250 n=185 • Pretest Mean (group)37.54 • Female mean: 36.18 • Male mean: 39.38 • Posttest Mean (group)80.00 • Female mean: 80.32 • Male mean: 80.50 No statistically significant difference between the genders
ExcelLab work ~ Post test 381 students took the test n=225 n=156 • Mean (group) 77.71 • Female mean: 78.08 • Male mean: 77.17 • tcrit(.05):1.65 • calculated t value: . .597779342 No statistically significant difference between the genders
ExcelPretest ~ Test out 337 students took the test n=175 n=162 • Mean (group) 81.85 • Female mean: 82.06 • Male mean: 81.62 • tcrit(.05):1.97 • calculated t value: .19522623 No statistically significant difference between the genders
PowerPointPretest ~ Lab work ~ Post test 244 students took the test n=149 n=95 • Pretest Mean (group)56.87 • Female mean: 58.32 • Male mean: 54.59 • Posttest Mean (group)87.89 • Female mean: 89.41 • Male mean: 85.51 No statistically significant difference between the genders
PowerPointLab work ~ Post test 213 students took the test n=126 n=87 • Mean (group) 89.26 • Female mean: 90.08 • Male mean: 88.08 • tcrit(.05):1.65 • calculated t value: 1.476781041 No statistically significant difference between the genders
PowerPointPretest ~ Test out 770 students took the test n=415 n=355 • Mean (group) 88.43 • Female mean: 87.88 • Male mean: 89.08 • tcrit(.05):1.97 • calculated t value: 1.254268287 No statistically significant difference between the genders
WordPretest ~ Lab work ~ Post test 474 students took the test n=162 n=116 • Pretest Mean (group)65.44 • Female mean: 67.36 • Male mean: 62.84 • Posttest Mean (group)84.14 • Female mean: 84.89 • Male mean: 83.13 No statistically significant difference between the genders
WordLab work ~ Post test 183 students took the test n=112 n=71 • Mean (group) 84.63 • Female mean: 85.83 • Male mean: 82.73 • tcrit(.05):1.65 • calculated t value: 1.629429123 No statistically significant difference between the genders
WordPretest ~ Test out 586 students took the test n=306 n=280 • Mean (group) 85.92 • Female mean: 86.16 • Male mean: 85.66 • tcrit(.05):1.97 • calculated t value: .52504364 No statistically significant difference between the genders
Results/Discussion • No real statistical difference between females and males with regard to MS Office productivity software • Supports NECS findings that males and females are equal with regard to computer usage
Results/Discussion • Does it support the suggestion that there are different uses of computers between the genders? • females higher in software that allows for communication and collaboration (PowerPoint and Word)
Surprises • Females also higher in the more “difficult” software: • Access • Lab work ~ Post testFemale mean: 85.44Male mean: 84.52 • Excel • Lab work ~ Post testFemale mean: 85.44Male mean: 84.52 • Pre test ~ Test outFemale mean: 82.06Male mean: 81.62 “Males may use computers to gather information or promote themselves.”