1 / 36

Chapter 2, Part A Descriptive Statistics: Tabular and Graphical Presentations

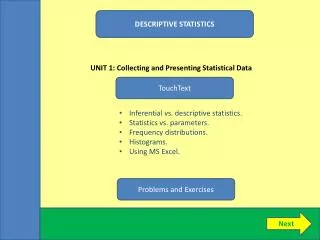
Summarizing Qualitative Data. Frequency DistributionRelative Frequency Distribution Percent Frequency DistributionBar GraphsPie Charts. A frequency distribution is a tabular summary of data showing the frequency (or number) of items in each of several non-overlapping classes.. The objective

maida
Download Presentation

Chapter 2, Part A Descriptive Statistics: Tabular and Graphical Presentations

An Image/Link below is provided (as is) to download presentation Download Policy: Content on the Website is provided to you AS IS for your information and personal use and may not be sold / licensed / shared on other websites without getting consent from its author. Content is provided to you AS IS for your information and personal use only. Download presentation by click this link. While downloading, if for some reason you are not able to download a presentation, the publisher may have deleted the file from their server. During download, if you can't get a presentation, the file might be deleted by the publisher.

E N D

Presentation Transcript


    More Related