Download
1 / 10
110 likes | 193 Views
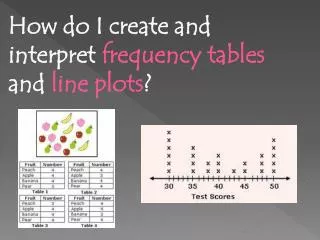
Line Plots and Frequency Tables. #31. VOCABULARY. The frequency of a data value is the number of times it occurs. A frequency table tells the number of times an event, category, or group occurs. whorl loop whorl loop arch arch loop whorl loop arch whorl arch arch whorl arch loop.

E N D
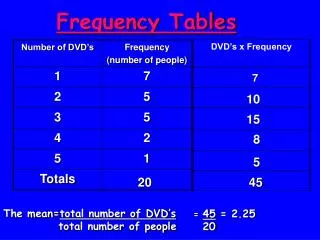
VOCABULARY The frequency of a data value is the number of times it occurs. A frequency table tells the number of times an event, category, or group occurs.
whorl loop whorl loop arch arch loop whorl loop arch whorl arch arch whorl arch loop Example 1: Using Tally Marks to Make a Frequency Table Students in Mr. Ray’s class recorded their fingerprint patterns. Which type of pattern do most students in Mr. Ray’s class have? Make a table to show each type of fingerprint.
Reading Math A group of four tally marks with a line through it means five. t llll = 5 llll llll = 10
whorl loop whorl loop arch whorl loop whorl loop whorl whorl arch arch whorl arch loop Example 1 Students in Ms. Gracie’s class recorded their fingerprint patterns. Which type of pattern do more students in Ms. Gracie’s class have? Make a table to show each type of fingerprint.
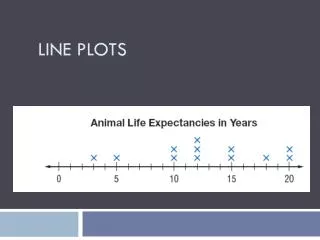
VOCABULARY A line plot uses a number line and x’s or other symbols to show frequencies of values.
Tennis Balls Collected 10 14 11 16 11 10 14 10 15 15 10 11 Example 2: Making a Line Plot Students collected tennis balls for a project. The number of balls collected by the students is recorded in the table. Make a line plot of the data.
Cans Collected 5 7 11 14 11 5 7 14 14 5 15 11 Example 3 Students collected aluminum cans for a project. The number of cans collected by the students is recorded in the table. Make a line plot of the data.
Pages Read Last Weekend 12 15 40 19 7 5 22 34 37 18 Example 4: Making a Frequency Table with Intervals Use the data in the table to make a frequency table with intervals.
Number of Miles Driven on Saturday 17 29 9 19 7 5 27 34 21 38 Example 5 Use the data in the table to make a frequency table with intervals.