Download
1 / 4
50 likes | 617 Views
Cause-and-Effect Diagram Learning Objectives. To understand how Cause-and-Effect Diagrams are used during process investigation To be able to construct a Cause-and-Effect Diagram. Cause-and-Effect Diagram Definition. Used to map variables that may influence a problem, outcome, or effect

E N D
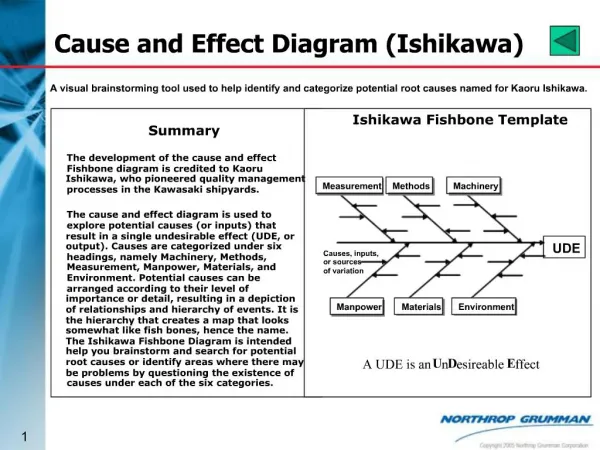
Cause-and-Effect DiagramLearning Objectives • To understand how Cause-and-Effect Diagrams are used during process investigation • To be able to construct a Cause-and-Effect Diagram
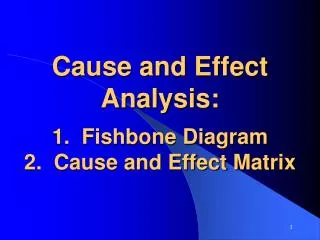
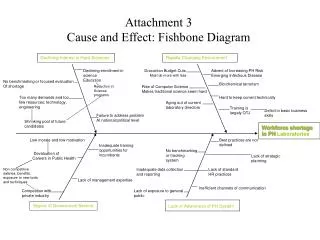
Cause-and-Effect Diagram Definition • Used to map variables that may influence a problem, outcome, or effect Also called: • Ishikawa diagram • Fishbone diagram
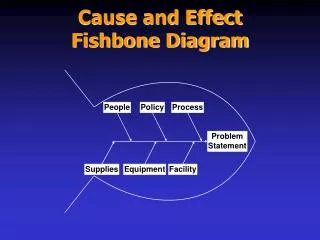
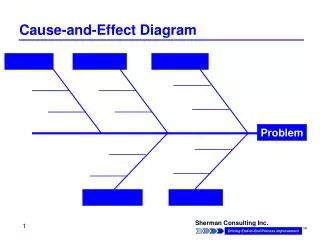
Cause-and-Effect DiagramProcess 1. Draw the diagram’s skeleton. 2. Write the problem or desired outcome in the box at the end of the arrow. • Equipment • Environment • Procedures • People 3. Brainstorm potential causes. 4. Review and refine causes.