Download
1 / 37
370 likes | 828 Views
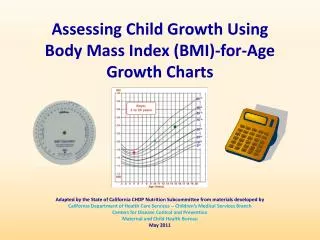
Child growth charts e-learning tool Judith Myers and Kay Gibbons October 2011. Session outline. Re-cap child growth and growth charts New equipment guidelines Practice examples – WHO under 2; CDC over 2 Introduce e-learning tool . Child Growth = marker of health and development .

E N D
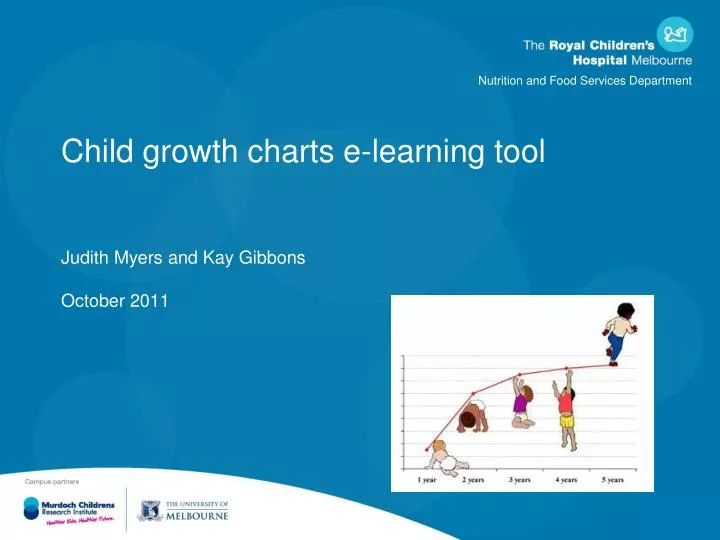
Child growth charts e-learning toolJudith Myers and Kay GibbonsOctober 2011
Session outline • Re-cap child growth and growth charts • New equipment guidelines • Practice examples – WHO under 2; CDC over 2 • Introduce e-learning tool
Child Growth = marker of health and development • Quick, non-invasive techniques • Plotting serial measurements on charts • Abnormal growth can indicate underlying health or developmental problems
‘Normal’ growth • Weight and length ‘tracking’ on centiles Growth influenced by: • Genetics and epigenetics • Ethnicity • Birthweight • Nutrition • Environment
Birth to 2 years Weight to nearest 10g To nearest 0.1cm purpose‘infantometer’ to nearest 0.1cm
Portable or fixed ‘for purpose’ To 100g / 0.1cm 2 & 3 ½ years
Use of Growth charts • Individuals • Growth monitoring • Growth failure or excessive growth • Impact of illness and response to treatment • Screening • NHMRC, 2002, NHMRC 2003, Cochrane, (Panpanich) 1999, deOnis 2006 , WHO 1995. Garza 2006, NHMRC 2011 • Population reporting • NHMRC, 2002
KAS Visits* Birth – 2 years Weight, length and head circumference Plotting on WHO charts 2 – 5 years Weight and stature at KAS visits BMI when indicated Plotting on CDC charts * And whenever clinically indicated KAS growth measuresand charts
Birth to 2 yearsWorld Health Organisation (WHO) http://www.who.int/childgrowth/standards/en/
Brazil Ghana India Norway Oman 80 USA 70 Mean of Length (cm) 60 50 0 200 400 600 Age (days) Effect of ethnicity on infant growth Onis et al. WHO child growth standards. ActaPaed 2006
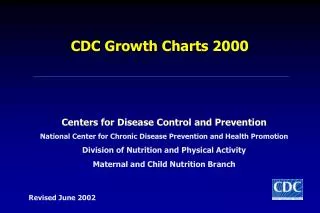
2 – 5 years CDC (Centre for Disease Control) http://www.cdc.gov/growthcharts/
Differences plotting 0 - 2 • Head circumference matches closely at all key ages • Birth weight position is similar on CDC or WHO at all centiles • Length pattern matches closely, but by 2 years, WHO appear slightly ‘taller’ in the lower centile range • At 6 months, infants plotted on WHO appear ‘lighter’ when compared with CDC • At 2 years, children in lower centiles appear ‘heavier’ on WHO compared with CDC
Summary of differences: WHO compared to CDC charts • More children 6 months - 2 years appear to grow slower • More children could be ‘overweight’ • More children < 6 months ‘underweight’ • More risk of ‘poor growth’ 2 – 4 months = breastfeeding
Principles of child growth assessment • Serial measurements of both weight and length / stature • Head circumference reflects early brain growth • Poor growth – decline in rate of weight gain first, followed by length/height gain • Appropriate growth when weight and length/height track along a curve – even it is ‘off’ chart • Correct for prematurity until 2 years
Further investigate Unexplained weight loss Weight not regained following acute illness Weight or length stature ‘plateau’ Weight, length / stature or BMI increasing or decreasing centiles • ‘Flags’ • Weight or length / stature < 5th centile • Weight or length /stature > 98th centile • BMI > 85th centile
Measure and Plotting • 2 week check • Birth weight is plotted at age ‘0’ (37+ weeks) • If more than 10% below birth weight at 2 weeks need to assess • Weight change = current – birth (g) • % weight loss = weight loss ÷ birth weight x 100% • Pre-term • Pre-term charts used until expected birth date (Kitchen 1983) • ‘Correct’ until 2 years (KAS framework 2009)
Measure and plotting 2 years • Weigh on either infant , platform scale or with parent/ carer • Measure height (stature) or recumbent length depending on child • Plot stature on CDC chart (length on WHO) • Plot on both if concerned • Child may appear ‘lighter’ transferring from WHO to CDC – this is normal • Child will appear ‘taller’ transferring from WHO to CDC – this is normal
Comparison 1: Boy weight for age CDC (left) and WHO (right) at 4 months
Comparison 1: Boy weight for age CDC (left) and WHO (right) at 4 months
Comparison 2: Boys weight for age: CDC (left) and WHO (right) at 2 years
Comparison 2: Boys weight for age: CDC (left) and WHO (right) at 2 years
Comparison 2: Boys weight for age: WHO (left) and CDC (right) at 2 years
Comparison 3: Boys length for age at 2 – WHO (left) and CDC (right)
Does changing to WHO make any difference to children’s growth assessment? Question
Comparison 4: ?underweight or normalWHO (left) and CDC (right)
Comparison 4: ?underweight or normalWHO (left) and CDC (right)
Summary of key points Chart changes don’t change individual child growth Stick to one chart Don’t rely on one measurement Trend is more important than a single measurement Need accurate measuring and plotting Need calibrated, high quality equipment Despite many parents’ perceptions the 50th percentile is not the goal for each child
www.cdc.gov/growthcharts/ www.who.int/childgrowth/standards/en http://consultations.nhmrc.gov.au/open_public_consultations/public-consultation-draf Cole TJ. BMI cut-offs BMJ 2007 Garza C. New growth standards for the 21st century 2006 de Onis. Comparison of the WHO and CDC growth charts 2007 Key references