Download
1 / 36
360 likes | 492 Views
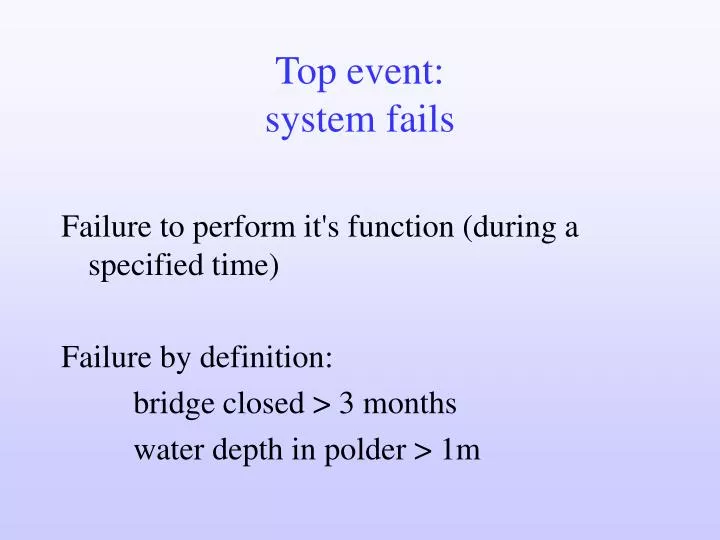
Top event: system fails. Failure to perform it's function (during a specified time) Failure by definition: bridge closed > 3 months water depth in polder > 1m. Function of the system. Dike protects against flooding Dam protects against flooding and generates hydropower.

E N D
Top event:system fails Failure to perform it's function (during a specified time) Failure by definition: bridge closed > 3 months water depth in polder > 1m
Function of the system • Dike protects against flooding • Dam protects against flooding and • generates hydropower
Basis is system theory • Divide into blocks with functions input output system S System description S1 B1 B2 B3
Systems • Physical components • Location (in a larger system) • Organisation • External / natural environment
System description
Eventtree faulttree • Eventtree: forward logic from the cause to all consequences • Faultree: backward logic traces the most unwanted consequence (top event) to all causes
Risk Analysis System description brainstorming hazards system analysis event trees fault tree fault trees hazards estimate of probabilities estimate of probabilities probability of top event RISK
Failure mode & effects analysis FMEA Element Deviation Consequence • Reliability (prob/year) • Availability (% of time) Analyse cause Probability or Frequency Counter measure
FMEA work sheet FMECA: risk = Ps D = Pf Pdlf D
input output system S System description S1 B1 B2 B3 B3 works output works works fails input fails fails B2 B1 system fails Event tree
System failure Or- gate B1 fails B2 fails B3 fails
upper bound • better approximation • single overriding mechanism • understandable
S1 B1 B2 B3 System description input output B1 B2 B3 works input works output fails works fails fails system fails Event tree
System failure And- gate B1 fails B2 fails B3 fails
Failure probability of a parallel system theoretical upper- and lower bound
No upper bound • common approximation • understandable
R<S R S 3
System failure m voting gate B1 fails B2 fails B3 fails
car passes red light and gate red light driver does not observe car passes red light driver does not observe red inhibit gate P(N observe| red light) red light P( red light)
system leaks and gate cock 1 leaks cock 2 leaks system leaks cock 1 leaks cock 2 leaks
Example of a flood defence system Faulttree polder:
Sub-Fault tree • The failure probabilities of all mechanisms are calculated by means of • Level III Monte carlo, Integration • Level II AFOSM + Hohenbichler to include dependence • - within each section • - between sections
Sub-Fault tree: Human failure is included in the analysis
Note: fault tree: top events ↔ consequence estimation • Faulttree analysis: select top events with comparable consequences • E.g.: failure of sluice door leads to smaller flooding than breaching of dike
Sea defense system Top-view Cross-section sleeper dreamer guard
Event tree guard sleeper dreamer works works fails works fails fails safe polder I polder I&II H.W. at sea all polders flooded
Fault tree system leaks priority and gate guard fails sleeper fails dreamer fails
common cause failure • Failure of the system by a single common cause • earthquake • electricity supply • identical machines/parts system leaks part 1 fails part 2 fails paralel system fails
environment of the system • organization & personnel • non-ideal complex categories "common cause" high water earthquake power supply driver's error service error single supplier single age group single batch spare parts
advantages of risk analysis • Insight in system failure • Insight in probability at failure • Tool of communication and management • Human failure and technical failure in one approach • Optimal design • Direct link to Quality Assurance