Download
1 / 34
340 likes | 697 Views
Pedestrian Detection in Crowded Scenes. Dhruv Batra ECE CMU. Pedestrian Detection in Crowded Scenes.

E N D
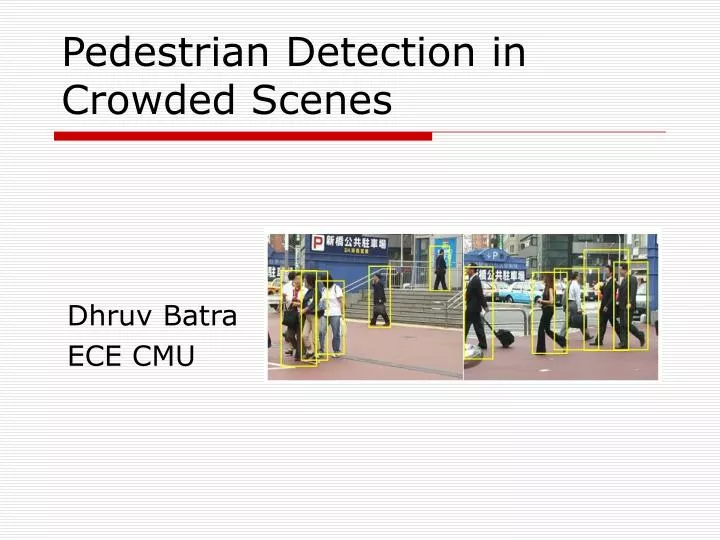
Pedestrian Detection in Crowded Scenes Dhruv Batra ECE CMU
Pedestrian Detection in Crowded Scenes Pedestrian Detection in Crowded Scenes. Bastian Leibe, Edgar Seemann, and Bernt Schiele. In IEEE International Conference on Computer Vision and Pattern Recognition (CVPR'05), San Diego, CA, June 2005. An Evaluation of Local Shape-Based Features for Pedestrian Detection. Edgar Seemann, Bastian Leibe, Krystian Mikolajczyk, and Bernt Schiele. In British Machine Vision Conference (BMVC'05) Oxford, UK, September 2005. Combined Object Categorization and Segmentation with an Implicit Shape Model. Bastian Leibe, Ales Leonardis, and Bernt Schiele. In ECCV'04 Workshop on Statistical Learning in Computer Vision, Prague, May 2004.
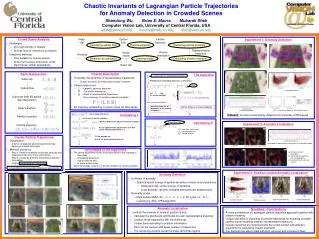
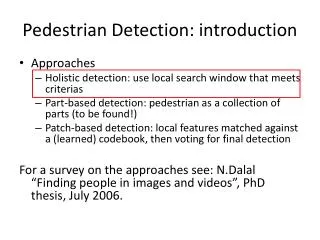
Theme of the Paper • Probabilistic top-down/bottom-up formulation of segmentation/recognition • Basic Premise: “[Such a] problem is too difficult for any type of feature or model alone”
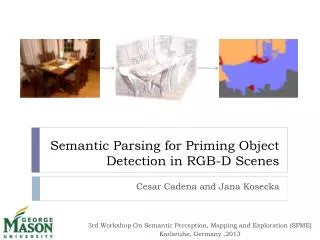
Theme of the Paper • Open Question: How would you do pedestrian detection/segmentation? • Solution: integrate as many cues as possible from many sources Original image Support of Segmentation from local features Support of segmentation from global features (Chamfer Matching) Segmentation from local features Segmentation from global features (Chamfer Matching)
Theme of the Paper • Goal: Localize AND count pedestrians in a given image • Datasets Training Set: 35 people walking parallel to the image plane Testing Set (Much harder!): 209 images of 595 annotated pedestrians
Evaluation Criteria • Criteria 1: Relative Distance Threshold d < 0.5 Fixed aspect ratio- 11:15
Evaluation Criteria • Criteria 2 & 3: Cover and Overlap Threshold cover >50% overlap >50%
Initial Recognition Approach • First Step: Generate hypotheses from local features (Intrinsic Shape Models) • Training: • Code book Approach (with spatial information)
Initial Recognition Approach • First Step: Generate hypotheses from local features (Intrinsic Shape Models) • Training: Lowe’s DoG Detector 3s x 3s patches Resize to 25 x 25
Initial Recognition Approach • First Step: Generate hypotheses from local features (Intrinsic Shape Models) • Training: • Agglomerative Clustering
Initial Recognition Approach • First Step: Generate hypotheses from local features (Intrinsic Shape Models) • Training: • Agglomerative Clustering
Initial Recognition Approach • First Step: Generate hypotheses from local features (Intrinsic Shape Models) • Training: • Agglomerative Clustering
Initial Recognition Approach • First Step: Generate hypotheses from local features (Intrinsic Shape Models) • Training: • Agglomerative Clustering store figure-ground masks for these entries Codebook entries
Initial Recognition Approach • First Step: Generate hypotheses from local features (Intrinsic Shape Models) • Training: • But wait! We just lost spatial information … Run again Lowe’s DoG Detector 3s x 3s patches Resize to 25 x 25 Learn Spatial Distribution Find codebook patches
Initial Recognition Approach • First Step: Generate hypotheses from local features (Intrinsic Shape Models) • Testing: • Initial Hypothesis: Overall
Initial Recognition Approach • First Step: Generate hypotheses from local features (Intrinsic Shape Models) • Testing: • Initial Hypothesis (Probabilistic Hough Voting Procedure) learnt from spatial distributions of codebook entries measuring similarity between patch and codebook entry Search for maximum in probability space Using a fixed size search window
Initial Recognition Approach • First Step: Generate hypotheses from local features (Intrinsic Shape Models) • Testing: • Initial Hypothesis: found as maxima in 3D voting space maxima computed using Mean Shift Mode Estimation over this balloon density estimator Uniform Cubicle Kernel
Initial Recognition Approach • First Step: Generate hypotheses from local features (Intrinsic Shape Models) • Testing: • Initial Hypothesis: Overall
Initial Recognition Approach • First Step: Generate hypotheses from local features (Intrinsic Shape Models) • Testing: • Initial Hypothesis: Overall
Initial Recognition Approach • First Step: Generate hypotheses from local features (Intrinsic Shape Models) • Testing: • Probabilistic top down segmentation Estimate from training data From similarity measure Assumption: Uniform Priors start here Intermediate Goal: Find this
Initial Recognition Approach • First Step: Generate hypotheses from local features (Intrinsic Shape Models) • Testing: • Probabilistic top down segmentation Substitute this here to get this Marginalized over all patches in image
Initial Recognition Approach • First Step: Generate hypotheses from local features (Intrinsic Shape Models) • Testing: • Probabilistic top down segmentation
Initial Recognition Approach • First Step: Generate hypotheses from local features (Intrinsic Shape Models) • Testing: • Probabilistic top down segmentation
Initial Recognition Approach • Second Step: Handling overlapping detections
Initial Recognition Approach • Second Step: Segmentation based Verification (Minimum Description Length) • Saving that can be achieved by explaining part of image by a particular hypothesis Number of pixels N explained by h Model complexity Cost of describing the error made by hypothesis h Probability of being a background Sum over all pixels hypothesized as figure
Initial Recognition Approach • Second Step: Segmentation based Verification (Minimum Description Length) • With this framework we can resolve conflicts between overlapping hypothesis Bias term Relative importance assigned to support of hypothesis
Initial Recognition Approach • Second Step: Segmentation based Verification (Minimum Description Length) • Voila! It works
Initial Recognition Approach • Second Step: Segmentation based Verification (Minimum Description Length) • Caveat: it leads to another set of problems Or four legs and three arms ISM doesn’t know a person doesn’t have three legs! Global Cues are needed
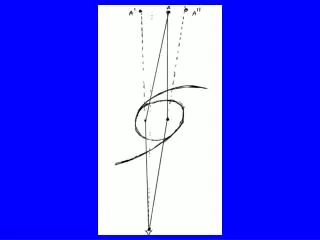
Assimilation of Global Cues • Distance Transform, Chamfer Matching get Feature Image by an edge detector get DT image by computing distance to nearest feature point Chamfer Distance between template and DT image
Assimilation of Global Cues (Attempt 1) • Distance Transform, Chamfer Matching Use scale estimate to cut out surrounding region Initial hypothesis generated by local features Apply Canny detector and compute DT Yellow is highest Chamfer score Chamfer distance based matching
Assimilation of Global Cues (Attempt 2) • Maximize Chamfer Score AND overlap with overlap with hypothesized segmentation instead of pure Chamfer Score Overlap expressed as Bhattacharya coeff. Joint score is linear combination of the two
Assimilation of Global Cues (Attempt 3) • Apply hypothesis saving MDL method again • Boolean quadratic formulation