Download
1 / 17
180 likes | 294 Views
Describing Motion. Physics 11. When we describe motion, we commonly use the Cartesian plane in order to identify an object’s position This is simply the x-y plane that you are familiar with from math class. Cartesian Coordinates. Cartesian Coordinates.

E N D
Describing Motion Physics 11
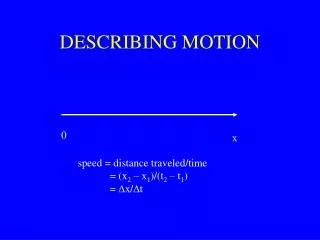
When we describe motion, we commonly use the Cartesian plane in order to identify an object’s position This is simply the x-y plane that you are familiar with from math class Cartesian Coordinates
Cartesian Coordinates • When considering an object in Cartesian Coordinates, it is important to determine a reference (zero) point • This is often where the object starts but can be an point that is convenient • Regardless of the reference point, all calculations will give the same result
Gebrselassie • At the Berlin Marathon in 2008, Ethiopian Haile Gebrselassie set a new world record for the marathon with a time of 2:03:59. The key to Gebrselassie’s success is his ability to maintain a constant pace through out the event. His split times for each 5km interval (and half marathon and marathon splits) are given below.
Using the data table, plot his position (d) on the y-axis and his time (t) on the x-axis. Ensure that you choose a scale that will enable you to use as much of the graph paper as possible. • Using the data, draw a line of best fit to the data and determine the slope of the line. What are the units for the slope in this instance? • For each 5km split (you can ignore the 21.1km and 42.2km) calculate his average speed in m/s by dividing the distance in metres by the time in seconds. • Compare the results for each segment in part 3 with the result for part 2. What do you notice? What you can say about his pacing?
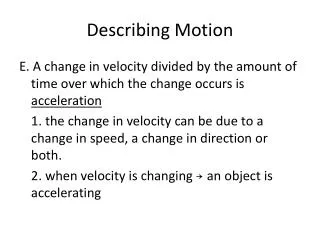
Scalars Most measurements you have used to this point are scalars This means that they have a magnitude (size) They include measurements such as mass, energy, distance, speed and time Vectors Many measurements in Physics are vectors In addition to a magnitude they also have a direction Velocity, displacement, momentum and acceleration are all vector quantities Vectors and Scalars
Position Vectors • A position vector is simply a vector (arrow) that connects the reference point of a coordinate system to an object Reference Point Position Vector
Displacement • Displacement is a vector quantity that measures the change in an object’s initial and final position
In physics, we will often start timing when something occurs (this provides a zero in time) We may also consider a time interval which is symbolized as Δt Time and Time Intervals
Velocity • Velocity is a vector quantity that is the rate of change of position; it is calculated as: If we remove the directional information from the velocity, we are left with speed:
Position and time data can be analyzed using multiple representations: • motion diagrams • Vectors • Graphs • Equations • Motion diagrams are a series of ‘dots’, numbered in succession and positioned to indicate direction • Time interval between each dot is equal • As an object’s speed increases, the dots on its motion diagram increase in separation • As an object’s speed decreases, the dots decrease in separation
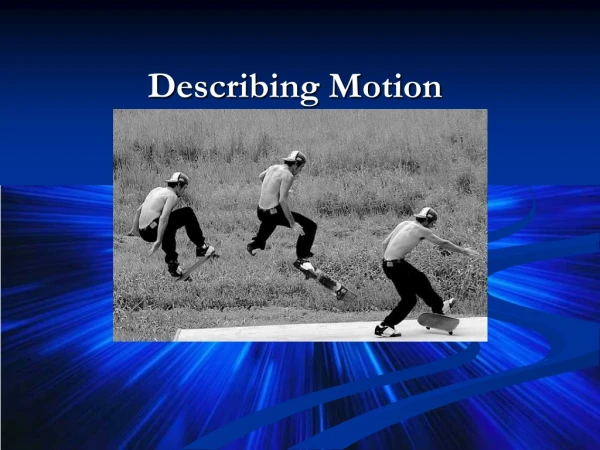
Examples of motion diagrams: Situation: A skateboarder rolling down the sidewalk at constant speed. A constant distance between the positions of the moving skateboarder shows that the object is moving with constant speed.
Examples of motion diagrams: Situation: A car stopping for a stop sign. A decreasing distance between the positions of the moving car shows that the object is slowing down.
Examples of motion diagrams: Situation: A sprinter starting a race. An increasing distance between the positions of the moving runner shows that the object is speeding up.
Examples of motion diagrams: Situation: A free throw in a basketball game. A more complicated motion (projectile motion) shows both slowing down (as the ball rises) and speeding up (as the ball falls).
Motion diagrams develop operational definitions for different motions, i.e. constant speed, slowing down, speeding up • Operational definitions are those defined in terms of particular procedure or operation performed by an observer. • Assume for now that motion is translational along a path or trajectory • An object is considered a particle, a mass at a single point in space • Particles have no shape, size or distinction between front and back or top and bottom
Practice Problems • Page 42 #1, 2