Download
1 / 14
140 likes | 211 Views
One-dimensional Spectra Provides. 1. Chemical shifts & Relative Intensities. 2. J-couplings. More Sophisticated Techniques Are Required for Proteins and Other Macromolecules. Thr. Thr. His. His. Asp. Asp. Ala. Ala. C O ’. H N. H a. H b. H b. H g. C a. C b. C b, C g.

E N D
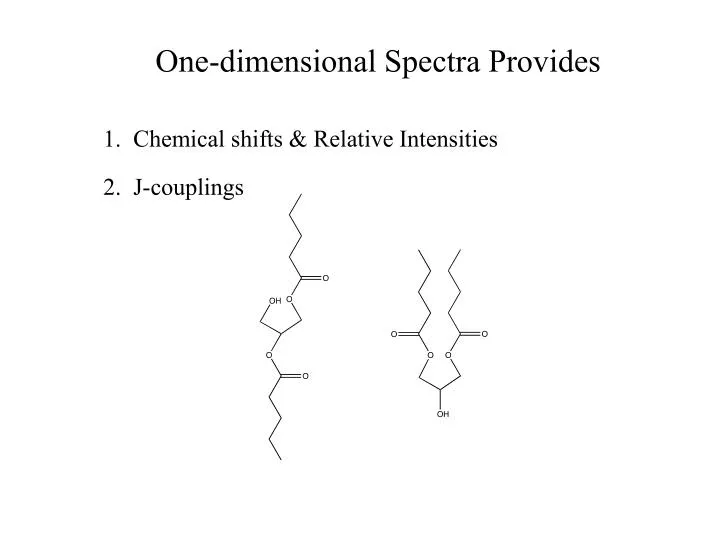
One-dimensional Spectra Provides 1. Chemical shifts & Relative Intensities 2. J-couplings
More Sophisticated Techniques Are Required for Proteins and Other Macromolecules Thr Thr His His Asp Asp Ala Ala CO’ HN Ha Hb Hb Hg Ca Cb Cb,Cg 1H (ppm) 13C (ppm)
Two-Dimensional Data Sets Greatly Increase Spectral Resolution 4) Record H frequencies 3) Transfer C to H Ile in D2O Acquisition Time 2h 1) Excite C 2) Record C frequencies Procedure For Recording a 2D Spectrum Minimally Involves Exciting the first nucleus Recording the frequencies of the first nucleus 3) Utilizing some type of physical interaction to transfer NMR signal to second nucleus 4) Recording the frequencies of the second nucleus
2D Spectra Provide Enhanced Resolution g 13C (ppm) b a 1H (ppm)
Increasing the Information Content Through Additional Interactions g Transfer H to H Transfer C to H b 13C (ppm) Record H frequencies Excite C Record C frequencies a 1H (ppm) NOTE: a-b connectivities for blue and green would also be observed (not shown so as to avoid complexity in the diagram)
3D Triple-Resonance Methods for Sequential Resonance Assignment of Proteins Strategy: Correlate Chemical Shifts of Sequentially Related Amides to the Same Ca (or Cb or CO)Chemical Shifts Intraresidue Correlation (HNCA) Interresidue Correlation (HN(CO)CA) Excite Ca Excite Ca Record Ca frequencies Record Ca frequencies Transfer to intraresidue N Transfer to intraresidue CO Record N frequencies Transfer to interresidue N Transfer to HN Record N frequencies Record H frequencies Transfer to interresidue HN Record H frequencies
Triple-resonance Data i i+1 Intraresidue Data (Both Ca & Cb) Interresidue Data (Both Ca & Cb)
Protein Chemical Shifts IndicateSecondary Structures with High Accuracy Assign Chemical Shifts (Referencing Relative to DSS) Compare Chemical Shifts to those in random coil peptides b-sheet a-helix Ca positive negative Cb none positive CO positive negative negative positive Ha Wishart, et al., Biochemistry, 31, 1647 (1992) Wishart, et al., J. Biomol. NMR, 4, 171 (1994)
Identification of Close Interproton Distances Protons separated in space by about 5 Å or less will influence the relaxation properties of one another (via dipole-dipole interactions): Known as the Nuclear Overhauser Effect, or NOE Importantly, note that this effect is in general distinct from the interaction between nuclei via J-couplings; J-couplings are mediated by electron orbital overlap between chemically bonded nuclei and are thus are only observed between nuclei separated by about 4 chemical bonds, or less NOEs instead can be observed in theory between any two possible protons within a molecule separated by 5 Å or less (irregardless of the number of chemical bonds by which the atoms are separated) rIS = internuclear distance f(tc) = statistical quantity which describes the timescale with which a molecule reorients in solution NOE µ (1/rIS6)f(tc)
NOEs in Structure Determination NOEs can be identified from a 2-D 1H-1H NOESY spectrum once the 1H resonance assignments are complete NOESY Procedure: Excite First Proton Record Proton Frequencies Transfer to Any proton 5 Å or less by NOE 4. Record Proton Frequencies
NOE Analysis - Practical Aspects Protein of 150 residues typically has about 30 possible NOEs per residue; unambiguous identification of these can be difficult with 2D NOE methods alone NOE spectra can be simplified and extended into more than two dimensions by employing isotope-editing Procedure: Excite nitrogen Record nitrogen frequencies Transfer to attached proton (J-coupling) Record proton frequencies Transfer to any proton 5 Å or less (NOE) Record Proton Frequencies
Isotope Editing Enhances Spectral Resolution Typically 3D 15N-edited NOESY 3D 13C-edited NOESY 4D 13C-edited, 13C-edited 4D 15N-edited, 13C-edited Typically, recover 10 - 15 interresidue NOEs per AA