Download
1 / 54
540 likes | 645 Views
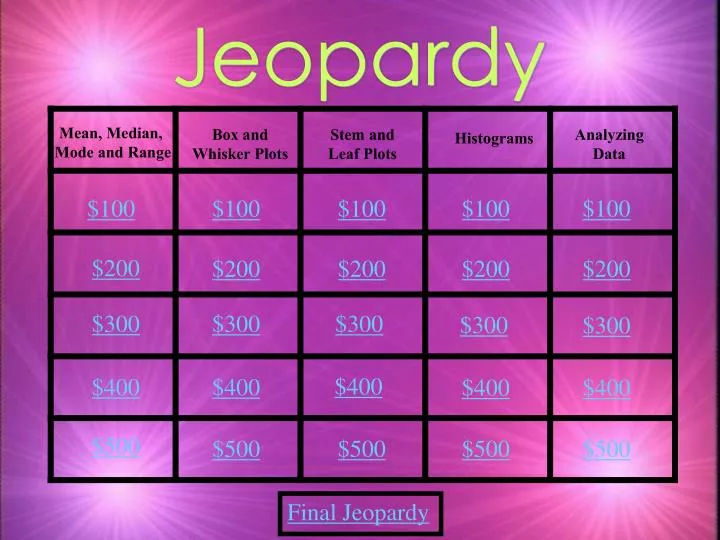
Jeopardy. Mean, Median, Mode and Range. Box and Whisker Plots. Stem and Leaf Plots. Analyzing Data. Histograms. $100. $100. $100. $100. $100. $200. $200. $200. $200. $200. $300. $300. $300. $300. $300. $400. $400. $400. $400. $400. $500. $500. $500. $500. $500.

E N D
Jeopardy Mean, Median, Mode and Range Box and Whisker Plots Stem and Leaf Plots Analyzing Data Histograms $100 $100 $100 $100 $100 $200 $200 $200 $200 $200 $300 $300 $300 $300 $300 $400 $400 $400 $400 $400 $500 $500 $500 $500 $500 Final Jeopardy
$ 100 What is the lower quartile for this set of data? A. 50 B. 91 C. 130 D. 157 E. 210 Click my picture to see the answer
$ 100 The lower quartile is (B) 91 A. 50 B. 91 C. 130 D. 157 E. 210 Click my picture to return to the Jeopardy Game Board
$ 200 What is the mode number of pets in this set of data? frequency Click my picture to see the answer
$ 200 The mode for this set of data is 1 pet. There were four students that only had one(1) pet. frequency Click my picture to return to the Jeopardy Game Board
$ 300 What is the range of pets for this set of data? frequency Click my picture to see the answer
$ 300 The range is the difference between the highest number and the lowest number. 14 - 0 = 14 The range is 14. frequency Click my picture to return to the Jeopardy Game Board
$ 400 The following were Janelle’s 8 quiz scores: 22 24 24 26 27 27 29 30 Janelle thought her median was 26 Jimmy thought her median was 26.5 And June thought her median was 27 Who was right, and why? Click my picture to see the answer
$ 400 The following were Janelle’s 8 quiz scores: 22 24 24 26 27 27 29 30 The median splits the data exactly in half. If you put four(4) numbers on each side of the median, it would be in-between 26 and 27. Jimmy was right, the median is 26.5 Click my picture to return to the Jeopardy Game Board
$ 500 What is the sum of the mean, median, and mode for the following set of data? 15 11 7 2 15 Click my picture to see the answer
$ 500 What is the sum of the mean, median, and mode for the following set of data? 2 7 11 15 15 Mean = 50 ÷ 5 =10 Median =11 Mode =15 Sum = 36 Click my picture to return to the Jeopardy Game Board
$ 100 Approximately what is the range of weekly incomes? A. $130 B. $70 C. $120 D. $160 E. $190 Click my picture to see the answer
$ 100 (C) 190 - 70 = $120 Click my picture to return to the Jeopardy Game Board
Quiz Scores $ 200 What are the values of the outliers? Click my picture to see the answer
Quiz Scores $ 200 Outliers are pieces of data that are significantly larger or significantly smaller than the majority of the data. The two outliers are 9 and 10 for the 2nd period class. Click my picture to return to the Jeopardy Game Board
Quiz Scores $ 300 Which two class periods have identical upper quartiles? Click my picture to see the answer
Quiz Scores $ 300 1st period and 2nd period have identical upper quartiles of 18.5. Click my picture to return to the Jeopardy Game Board
$ 400 Median 70 72 74 76 78 80 82 84 86 88 90 92 If the median for this set of data is 83.5, what is the lower quartile? Click my picture to see the answer
$ 400 median LQ = 77 70 72 74 76 78 80 82 84 86 88 90 92 There are 6 data points below the median. The lower quartile is between the 3rd point (75) and the 4th point (79). Therefore the LQ is 77. Click my picture to return to the Jeopardy Game Board
Quiz Scores $ 500 Why does 5th period appear to not have an upper whisker? Click my picture to see the answer
Quiz Scores $ 500 The reason why the upper whisker seems to have disappeared is that all scores in that whisker are the same value as the upper quartile (20). Click my picture to return to the Jeopardy Game Board
$ 100 How many students were surveyed in this poll? Click my picture to see the answer
$ 100 13 Students Click my picture to return to the Jeopardy Game Board
$ 200 What is the median for this set of data? Click my picture to see the answer
There are 22 pieces of data. If you count in 11 from both ends, you will end up with 2 middle numbers, 15 and 17. Half way between them is the median, 16. $ 200 Click my picture to return to the Jeopardy Game Board
$ 300 How many students live more than 10 miles from school? Click my picture to see the answer
$ 300 9 students live more than 10 miles from school? Click my picture to return to the Jeopardy Game Board
$ 400 What is the upper quartile for this set of data? Click my picture to see the answer
$ 400 median Upper quartile The upper quartile is 21. Click my picture to return to the Jeopardy Game Board
Weekly Salaries $ 500 What is the range for this set of data? Click my picture to see the answer
Weekly Salaries $ 500 By using the key, you can see that the maximum salary is $197 and the minimum salary is $100. The salary range is $197 - $100 = $97. Click my picture to return to the Jeopardy Game Board
$ 100 How many students scored 85% or higher on the semester test? Click my picture to see the answer
$ 100 5 10 12 27 Click my picture to return to the Jeopardy Game Board
$ 200 How many students scored between 14 and 18 on the Proportions/ Rates Quiz? Click my picture to see the answer
$ 200 15 + 23 = 38 Click my picture to return to the Jeopardy Game Board
$ 300 How many minutes students spend on homework Number of Minutes Spent on Homework When doing homework, which time interval contained exactly 15 students? Click my picture to see the answer
$ 300 How many minutes students spend on homework Number of Minutes Spent on Homework 15 Students spent 200 to 239 minutes or 200 to 240 minutes studying homework. Click my picture to return to the Jeopardy Game Board
$ 400 How many students took the semester test? Click my picture to see the answer
$ 400 6 + 5 + 12 + 14 + 13 + 6 + 7 + 10 + 5 + 10 + 12 =100 Click my picture to return to the Jeopardy Game Board
15 10 5 50 60 70 80 90 100 $ 500 Minutes watching TV Quickly sketch in the histogram for the data in the chart. Click my picture to see the answer
15 10 5 50 60 70 80 90 100 $ 500 Frequency 13 12 10 8 7 Minutes watching TV Click my picture to return to the Jeopardy Game Board
$ 100 Plane Flights There are 96 plane flights in this set of data. How many flights are above the median? Click my picture to see the answer
$ 100 Half of the flights are above the median. Therefore half of 96 flights are above the median. Half of 96 is 48. There are 48 flights above the median. Click my picture to return to the Jeopardy Game Board
$ 200 Which colored plane shows the most consistent flights? Click my picture to see the answer
$ 200 The Salmon plane has the smallest range. If you ignored the outliers, the Green plane would have been the most consistent. Click my picture to return to the Jeopardy Game Board
Students’ Swimming During June $ 300 There are 3 distinct clusters of information in this line plot. Give the maximum and minimum of each “cluster”. Click my picture to see the answer
Students’ Swimming During June } $ 300 } } The clusters of information are: 1 to 4, 8 to 13, and 15 to 20. Click my picture to return to the Jeopardy Game Board
$ 400 The upper quartile for this set of data is 21. If there are 40 students in this class, how many students scored above 21 on the quiz? Click my picture to see the answer
$ 400 Each section on a box plot contains 1/4 of the data. 1/4 of 40 is ten. Therefore there are 10 students who scored above the upper quartile of 21. 10 students 10 students 10 students 10 students Click my picture to return to the Jeopardy Game Board
$ 500 Plane Flights What percent of the data is above the lower quartile? Click my picture to see the answer