Download
1 / 1
10 likes | 74 Views
0.090. 0.090. 0.080. 0.080. 0.070. 0.070. ABS (AU) at 520 nm. ABS (AU) at 520 nm. 0.060. 0.060. 0.050. 0.050. 0.040. 0.040. 0.030. 0.030. time (min). time (min). 0.020. 0.020. 0.010. 0.010. 0.000. 0.000. 30. 30. 32. 32. 34. 34. 36. 36. 38. 38. 40. 40. 42. 42.

E N D
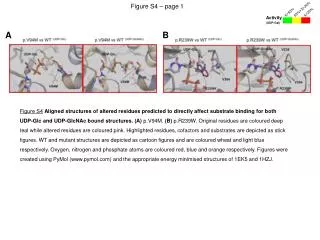
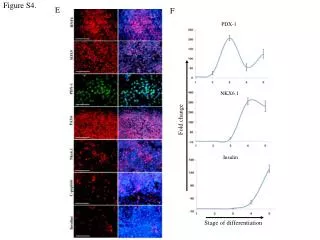
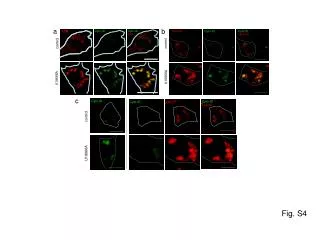
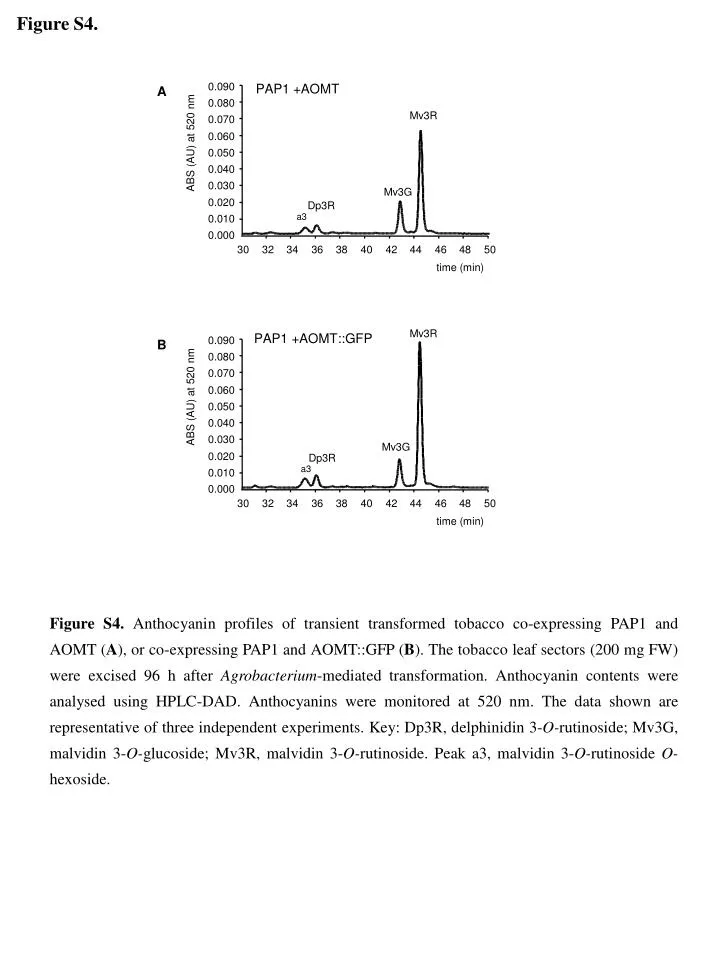
0.090 0.090 0.080 0.080 0.070 0.070 ABS (AU) at 520 nm ABS (AU) at 520 nm 0.060 0.060 0.050 0.050 0.040 0.040 0.030 0.030 time (min) time (min) 0.020 0.020 0.010 0.010 0.000 0.000 30 30 32 32 34 34 36 36 38 38 40 40 42 42 44 44 46 46 48 48 50 50 Figure S4. PAP1 +AOMT A Mv3R Mv3G Dp3R a3 Mv3R PAP1 +AOMT::GFP B Mv3G Dp3R a3 Figure S4. Anthocyanin profiles of transient transformed tobacco co-expressing PAP1 and AOMT (A), or co-expressing PAP1 and AOMT::GFP (B). The tobacco leaf sectors (200 mg FW) were excised 96 h after Agrobacterium-mediated transformation. Anthocyanin contents were analysed using HPLC-DAD. Anthocyanins were monitored at 520 nm. The data shown are representative of three independent experiments. Key: Dp3R, delphinidin 3-O-rutinoside;Mv3G, malvidin 3-O-glucoside; Mv3R, malvidin 3-O-rutinoside. Peak a3, malvidin 3-O-rutinoside O-hexoside.