Download
1 / 25
250 likes | 328 Views
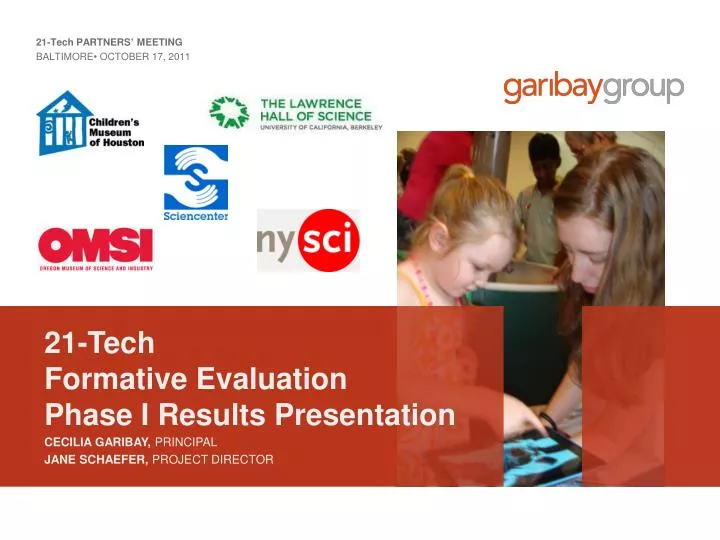
21-Tech PARTNERS’ MEETING BALTIMORE• OCTOBER 17, 2011. 21-Tech Formative Evaluation Phase I Results Presentation. CECILIA GARIBAY, PRINCIPAL JANE SCHAEFER, PROJECT DIRECTOR. Overview

E N D
21-Tech PARTNERS’ MEETING BALTIMORE• OCTOBER 17, 2011 21-Tech Formative Evaluation Phase I Results Presentation CECILIA GARIBAY, PRINCIPAL JANE SCHAEFER, PROJECT DIRECTOR
Overview 21-Tech is an IMLS-funded project focused on developing and broadly sharing methods for increasing the capacity of exhibit facilitators to use personal mobile technologies (PMT) to engage visitors in learning at their museums. A major aspect of the project focuses on testing strategies for using PMTs as part of facilitation. • This presentation was given to the 21-Tech partners by Garibay Group in order to generate team discussion and arrive at consensus about the Phase II testing. The overview section was added to provide context for the reader. Appendices were added as well. • Phase I Testing • Staff from the four partner museums (Children’s Museum of Houston, New York Hall of Science, Oregon Museum of Science and Industry, and Sciencenter) conducted Phase I Testing in July and August, 2011. This early testing phase was exploratory in nature and was designed to give staff the opportunity to pursue a range of questions about how PMTs might be used by facilitators to positively engage visitors in various exhibits. • Garibay Group worked with the project team in the development of testing protocols and instruments and analyzed data collected. • The overarching question selected by the project partners for Phase I was: • How can gallery facilitators in my organization use PMTs to lengthen, deepen, and extend visitor interactions? • Partners, however, also wanted to be able to pursue more specific questions of interest to their institutions and the 21-Tech project. Therefore, the more specific questions pursued during each round of testing varied both within and between partner institutions. (See sample questions in the blue box on the right.) • Phase I Testing Questions • The following are a sample of questions that emerged over the course of testing: • What are some strategies to work around distractions (e.g., high noise level, crowds, etc.)? • What kinds of exhibits interactions work the best, for instance, observing, hands-on, etc.? • How can we use the PMT in ways that are different from other extension activities? What about the PMT makes for a special or unique kind of interaction? Garibay Group | 21-Tech | Formative Evaluation Phase I Results Presentation | October 2011
Overview, cont’d. • Visitor groups were recruited from those visiting the partner museums on the data collection days. (See Appendix A for a summary of data collection rounds and visitor information.) • Data Documents • Documents analyzed included: • 27 testing debriefs completed after each round of testing; • Testing results synthesis summaries; • Interview documents from one-on-one partner interviews; • Monthly team meeting notes • During the testing period, the external evaluator interviewed each partner institution’s team members to assess the progress of the testing process and further discuss findings that were emerging from the testing. • After Phase I testing was complete, each institution created a synthesis • summary of their top three to five findings with supporting observations. • Throughout Phase I, the project team leads and coordinators and evaluators met monthly by phone to share progress, discuss findings, and reflect on their process. • Data Analysis • Garibay Group, as the external evaluator, conducted an independent analysis of Phase I testing data. • The testing debriefs were coded using and emergent coding strategy (Altheide, Coyle, DeVriese, and Schneider, 2008). With emergent coding, categories are established after an examination of the data. Instead of preconceived themes or categories, researchers analyze data (in this case the debrief documents) to identify themes that recur. Phase I Testing consisted of 21-Tech partner museum staff prototyping facilitation strategies with PMTs in one of more of their exhibits.Each partner site tested PMTs with visitors using a range of content (applications, games, videos, photographs, etc.). Each partner also made their own choices about what to try and in which exhibits to test PMTs. In most cases, testing took the form of peer-to-peer observations where one facilitator tested a scenario with visitor groups and another team member took notes. In some cases, a facilitator tested a scenario with visitors and then was interviewed about the test afterwards by another team member. Staff then completed a debrief where they recorded data about visitor groups, interactions, observations, and findings. Garibay Group | 21-Tech | Formative Evaluation Phase I Results Presentation | October 2011
Overview, cont’d. As patterns and themes were identified, researchers used a constant comparison method to tease out the strength of these patterns and themes (Miles and Huberman, 1994). Coded data were then clustered and analyzed to look for interrelation-ships between categories, which then allowed us to more specifically refine broad themes and sub-categories. (See Appendix B for a sample coding scheme developed from 21-Tech data analysis.) A major limitation in analyzing the debriefs was that there was not always enough description of the interactions to independently verify the conclusions stated in the debrief document. Researchers were able to address this limitation, to some extent, by examining summaries, partner interviews, and team meeting notes. These documents helped supplement and flesh out the debrief data and served to clarify areas where data were not always clear or detailed enough and generally helped triangulate findings. . Garibay Group | 21-Tech | Formative Evaluation Phase I Results Presentation | October 2011
Using PMTs to Engage Visitors Based on testing data, we identified four categories that influenced the interaction between a visitor and facilitator, which ultimately impacted both visitor and facilitator when PMTs were used. Though these categories may overlap to some extent, separating them allowed us to more systematically organize findings and more easily discuss them. * Includes applications, games, videos, photographs, pdf’s, etc.
Facilitation Skills • In order to successfully use and engage visitors with PMTs, facilitators need comfort with and knowledge of the following: • The content of the exhibit or component • The apps that will be used and how they relate to the exhibit or component • The device, including how to access apps on it • Ways to integrate the PMTs into their facilitation with the visitor • Implication: Targeted training is needed that addresses all four areas.
Devices • Tablets, such as the iPad, tended to work better during interactions than smaller devices, such as the iTouch, because they were: • Big enough to be shared easily by more than one person • Easy to see what is displayed on them • Implication: From a research standpoint, do smaller devices need more testing or does the 21-Tech team feel that tablets are the ideal PMT for facilitation?
Apps • Based on the data from all partners, the three categories for apps defined by the Children’s Museum of Houston seemed to hold: • Concept Enrichment (e.g, Richochet, the Elements, bee videos) that help explain something in more depth; • Skill Building (e.g., Launch Cage Paper Airplanes, Steady Hand) that allow a visitor to practice how to do something; • Exploration and Experimentation Tools (e.g., Widget Wall, Giant Timer, iSeismometer) that help visitors quantify phenomena. • Implication: These categories might be a useful in helping identify ways to enrich experiences. Categories may be revised and refined as data are gathered during Phase II testing.
Apps • Apps that worked well during interactions have the following characteristics: • A tight relationship to the physical exhibit or component that is easy for the visitor to understand • Easy for visitors to understand how to use • Not so compelling as a standalone app that it takes away from the exhibit experience • Work for multi-aged social groups (i.e, apps are “juicy” enough for adults and children to use) • Age-appropriateness needs to be considered. The target age range for the 21-Tech project is5 to 13 years old. Implication: Selection of appropriate apps takes careful consideration, and 21-Tech partners have spent significant time finding appropriate apps.
Exhibit • Types of exhibits where facilitation using PMTs worked well: • Those where PMT apps could show visitors something they could not see in the exhibit (e.g., Bees, Sports Challenge) • Those where adding a challenge could make it more engaging (e.g., Mt. Boulder) • Those that provoked questions that could be answered using on-the-floor, on-demand references (e.g., Chemistry Lab) • Those in which visitors have to wait for turns (e.g., Facepainting) • Those that were not too loud or crowded Implication: An outstanding question is can all exhibits benefit from PMT-based facilitation?
Visitor Impact • Based on an analysis of debriefs, documentation of supporting observation about visitor engagement were not detailed enough to make definitive conclusions. The following statements were made regarding interactions in which facilitators used PMTs: • Interactions were richer when PMTs were used • Interactions lasted longer with PMTs • Visitors were more excited about the interactions with PMTs • PMTs made visitors more comfortable with facilitator Implication: Focus on documenting and understanding how facilitation using PMTs impacts the quality of visitor interactions.
Facilitator Impact • Based on an analysis of debriefs, documentation of supporting observation about facilitator impact were not detailed enough to make definitive conclusions. The following statements were made regarding facilitators: • PMT use was increasing facilitators’ knowledge and skill sets • PMT use was making facilitators more confident about facilitation Implication: Focus on documenting and understanding how using PMTs impacts facilitators.
Questions that Emerged from the Data • What are the characteristics of a tight relationship between exhibit and app? • Does every exhibit need PMT-based facilitation? • What are the characteristics of successful engagements for a visitor group? • Do smaller devices need more testing or does the 21-Tech team feel that tablets are the ideal PMT for facilitation?
Potential Directions for Next Phase • Based on Phase I research, the 21-Tech team might consider the following: • Narrow the research question(s) • Describe the nature of the visitor-facilitator interaction • Document how facilitation using PMTs impacts the quality of visitor interactions • Document how using PMTs impacts facilitators • Work on more standardized data collection
References . Altheide, D., Coyle, M., DeVriese, K., & Schneider, C. (2008). Emergent Qualitative Document Analysis. In Handbook of Emergent Methods. Hesse-Beiber, S.N. and Levy, P., eds., NY, NY: Guilford Press. Miles, M. B. & Huberman, A. M. (1994). Qualitative Data Analysis (2nd ed.). London: Sage. Garibay Group | 21-Tech | Formative Evaluation Phase I Results Presentation | October 2011
Appendix A : Data Collection Rounds, cont’d. Age distribution could not be calculated for the Oregon Museum Science and Industry.
Appendix B: Sample Coding Scheme