Download
1 / 18
190 likes | 556 Views
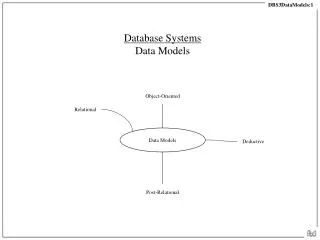
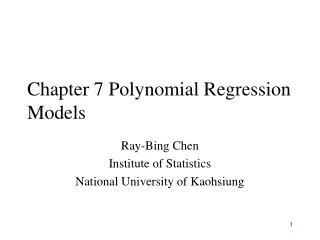
Model Comparison: Top-Down vs. Bottom-Up Models. P.R. Shukla. Energy Models. Top-Down. Bottom-Up. Equilibrium. Macro- Optimisation & Simulation . Technology Assessment. Single-Country. Multi-Region. Classification of Energy Sector Models. Technology. Resource. Secondary Energy.

E N D
Model Comparison: Top-Down vs. Bottom-Up Models P.R. Shukla
Energy Models Top-Down Bottom-Up Equilibrium Macro- Optimisation & Simulation Technology Assessment Single-Country Multi-Region Classification of Energy Sector Models
Technology Resource Secondary Energy End-Use Lighting Coal Light Bulb Cooking Electricity Generation Car Gas Transport Heater Heating Crude Oil Stove Drive Renewable Oil Refinery Motor Irrigation Nuclear Pump Water Supply Reference Energy System
Soft Linked Integrated Modeling Framework TOP DOWN MODELS Productivity SGM ERB Model Global Energy Prices GDP Prices Energy Balance BOTTOM-UP MODELS Scenarios MARKAL Stochastic MARKAL Technology Details Power Sector LP Model End-use Demand Technology Share End-use Demand Demand Projection AIM/ENDUSE Technology Specifications Health Costs OTHER MODELS Inventory Estimation Model Emissions Health Impact GIS based Energy & Model Emissions Model
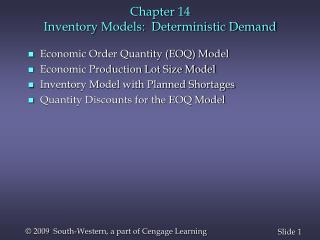
Model Objective Output Policy Analysis End-Use Demand Projection Demand Projections consistent with macroeconomic scenario End-use Sector Demand Trajectory Sectoral investment, technology and infrastructure policies AIM/ENDUSE Minimize discounted sectoral cost Sectoral energy, and technology mix, investments and emissions Sectoral technology, energy, investment and emissions control policies MARKAL Minimize discounted Energy system cost National energy and technology mix, energy system investments, and emissions Energy sector policies like energy taxes and subsidies; energy efficiency; emissions taxes and targets Stochastic-MARKAL Minimize expected value of discounted system cost Energy and technology mix under uncertain future, Value of information Hedging strategies for energy system investments; identify information needs Model Characteristics: Bottom-Up Models
Model Objective Output Policy Analysis SGM Determine market clearing prices for economic sector outputs GDP and consumption trajectories;, prices of sectoral outputs and energy; sectoral investment patterns Macro-economic impacts of policy interventions such as energy tax / subsidies; emissions limitations ERB Determine Global / Regional Energy Prices and Energy Use Long-term global and regional energy prices, energy mix and emissions Implications of very long-term global energy resource, tech. expectations Model Characteristics: Top-Down Models
Model Objective Output Policy Analysis Model Characteristics: Other Models Inventory Estimation Model Estimate national emission inventory for various gases National emission inventory Regional and sectoral emission variability, bench-marking, emission hot-spot assessment GIS Based Energy and Emission Model Determine regional spread of energy and emissions Regional maps Linking energy and environment policies across time and space Power Sector LP Model Minimize discounted Power sector cost Power plant capacity and generation mix, emissions profile, total costs Power sector technology, energy, investment, emissions control policies Health Impact Model Estimate local pollutant emission impacts on human health Impact of individual plants, per capita and total national human health impacts, sensitivity analysis Plant location and stack height policies, emission norm analysis, enforcement policy assessment
GDP loss over base case: Carbon Tax scenarios Tax Scenarios 25/ tC 50/ tC $100/ tC
Energy Consumption: Carbon Tax cases Tax Scenarios
Technology Mix in Brick Production 140 High Draught VSBK 120 Clamps (Biomass) 100 Bull trend Kiln 2 Bull trend Kiln 1 80 Billion Nos. 60 40 20 0 1995 2000 2005 2010 2015 2020 2025 2030 2035 Year
Sectoral Energy consumption (EJ) From 1995-2035 Industry & Residential Grow 3.5 times Commercial Grows 9 times Agriculture Stagnates Transport Grows 5 times