Download
1 / 31

E N D
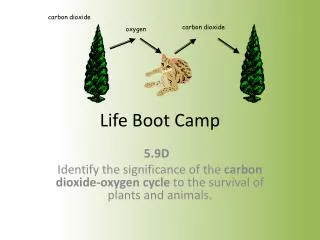
Lesson Topic: Rational numbers including fractions, decimals, percents, and ratiosLesson Objective: Students will convert between expressions for rational numbers.Vocabulary:Rational number – a number that can be written as a/b and b cannot be 0.Decimals – a number that uses a decimal point to show a value less than 1.Fraction – a number written in the form of a ratio a/b. The top number is the numerator and the bottom number is the denominator.Percent – a ratio that shows the parts per hundredEquivalent – 2 expressions of statements that have the same value..
Remember:Rational numbers include all integers and whole numbers
Lesson Topic: Absolute valueLesson Objective: Students will express that a number’s distance from zero on the number line is it’s absolute value.Vocabulary:Absolute value – the absolute value of a number is the distance between the number and 0 on a number line. It is written l 4 l.
Lesson Topic: Adding and Subtracting Integers with modelsLesson Objective: Students will apply and interpret the concepts of addition and subtraction with integers using models.Vocabulary: Positive integer – a number greater than 0Negative integer – a number less than 0Zero – it is neither positive nor negativeOpposite – same distance from 0 on a number line.Remember when adding or subtracting integers:same same = sumdifference = different
Lesson Topic: Prime FactorizationLesson Objective: Students will use prime factorization to express a whole number as a product of its prime factor and determine the greatest common factor and least common multiple of two whole numbers.Vocabulary:Prime number – a whole number that is greater than 1 whose only whole number factors are 1 and itself.Composite number – a whole number greater than 1 that has positive factors other than 1 and itself.Remember:You can use a factor tree to write the prime factorization of a number.
Lesson Topic: Division of DecimalsLesson Objective: Students will divide multi-digit whole numbers and decimals by decimal divisors with and without remainders.Vocabulary:Dividend – The number being dividedDivisor – The number that dividend is being divided by.
Lesson Topic: Multiplication and Division of FractionsLesson Objective: Students will multiply and divide fractions.Vocabulary:Product – The answer to a multiplication problem.Numerator – the top number in a fraction.Denominator – the bottom number in a fraction.Reciprocal – two nonzero numbers whose product is 1.Remember:Multiplication – Multiply the numerators straight across then multiply the denominators straight acrossDivision – Flip the 2nd fraction for its reciprocal then multiply the numerators straight across then multiply the denominators straight across.
Lesson Topic: Simplifying using order of operationsLesson Objective: Students will simplify numerical expressions using the order of operations with or without grouping symbolsRemember:G - Grouping symbolsE – ExponentsM – Multiplication/ DivisionS – Subtractions/ AdditionGEMS
Lesson Topic: Evaluating ExpressionsLesson Objective: Students will evaluate an expression involving the four basic operations by substituting given fractions and decimals for the variable.Vocabulary:Variable – a letter is used to represent one or more numbers.Variable expression – like n + 6, consists of numbers, variables, and operations.Evaluate – a variable expression, you substitute values for the variables and then simplify the resulting numerical expression.4 basic operations – addition, subtraction, multiplication, and division
Lesson Topic: 2 Step EquationsLesson Objective: Students will create and solve two-step equations that can be solved using inverse properties with fractions and decimals.Vocabulary:Inverse operation – an operation that undoes another operationAddition & Subtraction = InversesMultiplication & Division = Inverses
Lesson Topic: Problem SolvingLesson Objective: Students will identify relevant, missing, and extraneous information related to the solution to a problem.
Lesson Topic: Numerical SequencesLesson Objective: Students will recognize, describe, create, and analyze a numerical sequence involving fractions and decimals using all four basic operations.
Lesson Topic: Data AnalysisLesson Objective: Students will solve problems by selecting, constructing, and interpreting displays of data, including histograms and stem-and-leaf plots.Vocabulary:Population – Entire group of people or objects that you want information about.Sample – Part of the population that is being surveyed.Random sample – Each person of object has an equally likely chance of being selected.Biased sample – A non-random sample that is not a complete representation of the population.
Bar graph – One way to represent data visually. A bar graph the lengths of the bars are used to represent and compare data. The bars can be horizontal or vertical.Line graph – Another way to represent data visually. In a line graph, points that represent data pairs are connected using line segments. Line graphs often show CHANGE over TIME.Stem-and-leaf plot – a data display that helps you see the way data are distributed. It can be put in increasing order.Histogram – a graph that displays data from a frequency table. The bars should not have a space between them and it should include horizontal gridlines.Frequency table – is used to group data values into intervals.Frequency – is the number of values that lie in the interval.
Appropriate times to use each of the data displays:Bar graph – to display data in distinct categoriesLine graph – display data over timeStem-and-leaf plot – to group data into ordered listsHistogram – to compare the frequencies of data that fall in equal categories
Lesson Topic: Line Graphs and ScatterplotsLesson Objective: Students will determine a pattern to predict missing values on a line graph or scatterplot.
Lesson Topic: Vertex Edge GraphingLesson Objective: Students will solve problems related to Hamilton paths and circuits.Vocabulary:Vertex edge graph - A collection of points and line segments connecting some (possibly empty) subset of the pointsEdge - A line segment connecting the vertices of a graph. The edge represents a distance.Vertex –A point that is either the endpoint of an edge or not part of an edge. The vertex represents a place.Euler path – A path that visits every edge once, (Vertices may be revisited, but edges may not be repeated.)Euler circuit – A path that visits every edge exactly once and begins and ends at the same vertex.
Path: A connected sequence of edges that start at a vertex and ends at a vertex. Usually you describe a pathby naming the sequence of vertices in the path. Circuit: A path that begins and ends at the same vertex.Hamilton Circuit: A Hamilton circuit begins and ends at the same vertex.Hamilton Path: A path that visits every vertex exactly once; regardless of how many edges are traced.Number of Vertices: A vertex is a point on a vertex-edge graph.(vertices = more than one vertex)
Lesson Topic: ProbabilityLesson Objective: Students will use data collected from multiple trials of a single event to form a conjecture about the theoretical probability.Vocabulary:Probability – the measure of liklihood that the event will occur in an eventOutcome – the possible results of an experimentEvent – the collection of outcomesFavorable outcomes – The outcomes for a specified eventTheoretical probability – based on knowledge of knowing all of the equally likely outcomesExperimental proabilaity – probability based on repeated trials of an experiementRemember:You can use tree digrams to help you find the possible outcomes of an event using branches to list choices.
Lesson Topic: Counting Problems with Venn DiagramsLesson Objective: Students will explore counting problems with Venn Diagrams using three attributes.Vocabulary:Counting principle – If one event can occur in m ways, and for each of these a second event can occur in n ways, then the number of ways that the two events can occur together is m X n.
Lesson Topic: MeasurementLesson Objective: Students will solve problems involving conversion within the U.S. customary and the metric system.Vocabulary:Metric units – a base-ten system. Metric prefixes are associated with decimal place values.Larger unit to smaller unit = multiplicationSmaller unit to larger unit = division
U.S. Customary System – the units of measurement for length, weight, and capacity commonly used in the United States.Length:Inch (in)Foot (ft)Yard (yd)Mile (mi)Weight:Ounce (oz)Pound (lb)Ton (T)Capacity:Fluid ounce (floz)Cup (c)Pint (p)Quart (qt)Gallon (gal)
Lesson Topic: Transformations in a Coordinate PlaneLesson Objective: Students will draw a reflection of a polygon in the coordinate plane using a horizontal or vertical line of reflection. Vocabulary:Coordinate plane – intersection of a horizontal number line and a vertical number line.X axis – Horizontal number lineY axis – Vertical number lineOrigin – Point where x and y axis meet Quadrants – The coordinate plane is divided into 4 quadrants.
Transformation – a movement of a figure in a planeImage – the new figure that is formed by the transformationTranslation – a slide of a figure. Each figure is moved the same distance in the same direction.Reflection – a flip of a figure. A figure is reflected in a line called the line of reflection creating a mirror image.Rotation – a turn of a figure. A figure is rotated through a given angle in a given direction about a fixed point called the center of rotation.
Lesson Topic: Geometric Figures on a Coordinate PlaneLesson Objective: Students will state the missing coordinate of a given figure on the coordinate plane using geometric properties to justify the solution.
Lesson Topic: Area and Perimeter of regular and irregular polygonsLesson Objective: Students will solve problems involving area and perimeter of regular and irregular polygons.Vocabulary:Area – The number of units needed to cover the inside of the figure.Perimeter – The sum of the lengths of all of the sides.Polygon – A geometric figure that is made up of three or more line segments that intersect only at their endpoints.Regular polygon – A polygon with all sides equal in length and all angles in measure. Irregular polygon – A polygon that does not have equal length in sides and all angles do not measure the same.
Lesson Topic: Area of Simple PolygonsLesson Objective: Students will solve problems involving the area of simple polygons using formulas for rectangles and triangles.Formulas for Area:Rectangles – length x widthTriangles – ½ (base x height)
Lesson Topic: Area of Parallelograms and TrianglesLesson Objective: Students will create and justify an algorithm to determine the area of a given compound figure using parallelograms and triangles.Formulas for area:Parallelogram – base x heightTriangle – ½ (base x height)
Lesson Topic: VolumeLesson Objective: Students will describe the relations between the volume of a figure and the area of its base.Vocabulary:Volume – The amount of space that a solid contains.Formula for volume:Rectangle – Length x width x heightCylinder – 3.14 x radius2 x height