Download
1 / 1
10 likes | 97 Views
Examinations of the relative alignment of the instruments on SOT T. J. Okamoto, Y. Katsukawa, T. Shimizu, K. Ichimoto, Y. Suematsu, S. Tsuneta, T. Tarbell, and SOT team. Abstract.

E N D
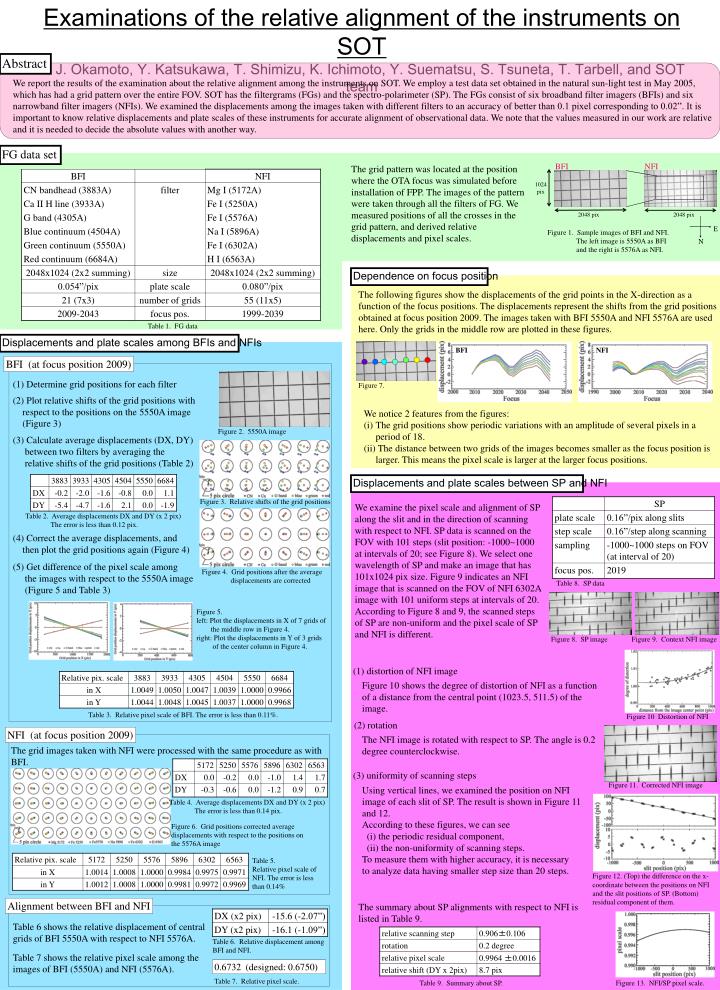
Examinations of the relative alignment of the instruments on SOT T. J. Okamoto, Y. Katsukawa, T. Shimizu, K. Ichimoto, Y. Suematsu, S. Tsuneta, T. Tarbell, and SOT team Abstract We report the results of the examination about the relative alignment among the instruments on SOT. We employ a test data set obtained in the natural sun-light test in May 2005, which has had a grid pattern over the entire FOV. SOT has the filtergrams (FGs) and the spectro-polarimeter (SP). The FGs consist of six broadband filter imagers (BFIs) and six narrowband filter imagers (NFIs). We examined the displacements among the images taken with different filters to an accuracy of better than 0.1 pixel corresponding to 0.02”. It is important to know relative displacements and plate scales of these instruments for accurate alignment of observational data. We note that the values measured in our work are relative and it is needed to decide the absolute values with another way. FG data set BFI NFI The grid pattern was located at the position where the OTA focus was simulated before installation of FPP. The images of the pattern were taken through all the filters of FG. We measured positions of all the crosses in the grid pattern, and derived relative displacements and pixel scales. 1024 pix 2048 pix 2048 pix E Figure 1. Sample images of BFI and NFI. The left image is 5550A as BFI and the right is 5576A as NFI. N Dependence on focus position The following figures show the displacements of the grid points in the X-direction as a function of the focus positions. The displacements represent the shifts from the grid positions obtained at focus position 2009. The images taken with BFI 5550A and NFI 5576A are used here. Only the grids in the middle row are plotted in these figures. Table 1. FG data Displacements and plate scales among BFIs and NFIs BFI NFI BFI (at focus position 2009) (1) Determine grid positions for each filter Figure 7. (2) Plot relative shifts of the grid positions with respect to the positions on the 5550A image (Figure 3) • We notice 2 features from the figures: • The grid positions show periodic variations with an amplitude of several pixels in a period of 18. • The distance between two grids of the images becomes smaller as the focus position is larger. This means the pixel scale is larger at the larger focus positions. Figure 2. 5550A image (3) Calculate average displacements (DX, DY) between two filters by averaging the relative shifts of the grid positions (Table 2) Displacements and plate scales between SP and NFI Figure 3. Relative shifts of the grid positions We examine the pixel scale and alignment of SP along the slit and in the direction of scanning with respect to NFI. SP data is scanned on the FOV with 101 steps (slit position: -1000~1000 at intervals of 20; see Figure 8). We select one wavelength of SP and make an image that has 101x1024 pix size. Figure 9 indicates an NFI image that is scanned on the FOV of NFI 6302A image with 101 uniform steps at intervals of 20. According to Figure 8 and 9, the scanned steps of SP are non-uniform and the pixel scale of SP and NFI is different. Table 2. Average displacements DX and DY (x 2 pix) The error is less than 0.12 pix. (4) Correct the average displacements, and then plot the grid positions again (Figure 4) (5) Get difference of the pixel scale among the images with respect to the 5550A image (Figure 5 and Table 3) Figure 4. Grid positions after the average displacements are corrected Table 8. SP data Figure 5. left: Plot the displacements in X of 7 grids of the middle row in Figure 4. right: Plot the displacements in Y of 3 grids of the center column in Figure 4. Figure 8. SP image Figure 9. Context NFI image (1) distortion of NFI image Figure 10 shows the degree of distortion of NFI as a function of a distance from the central point (1023.5, 511.5) of the image. Table 3. Relative pixel scale of BFI. The error is less than 0.11%. Figure 10 Distortion of NFI (2) rotation NFI (at focus position 2009) The NFI image is rotated with respect to SP. The angle is 0.2 degree counterclockwise. The grid images taken with NFI were processed with the same procedure as with BFI. (3) uniformity of scanning steps Figure 11. Corrected NFI image Using vertical lines, we examined the position on NFI image of each slit of SP. The result is shown in Figure 11 and 12. According to these figures, we can see (i) the periodic residual component, (ii) the non-uniformity of scanning steps. To measure them with higher accuracy, it is necessary to analyze data having smaller step size than 20 steps. Table 4. Average displacements DX and DY (x 2 pix) The error is less than 0.14 pix. Figure 6. Grid positions corrected average displacements with respect to the positions on the 5576A image Table 5. Relative pixel scale of NFI. The error is less than 0.14% Figure 12. (Top) the difference on the x-coordinate between the positions on NFI and the slit positions of SP. (Bottom) residual component of them. Alignment between BFI and NFI The summary about SP alignments with respect to NFI is listed in Table 9. Table 6 shows the relative displacement of central grids of BFI 5550A with respect to NFI 5576A. Table 6. Relative displacement among BFI and NFI. Table 7 shows the relative pixel scale among the images of BFI (5550A) and NFI (5576A). 0.6732 (designed: 0.6750) Table 7. Relative pixel scale. Table 9. Summary about SP. Figure 13. NFI/SP pixel scale.