Download

1 / 55
560 likes | 707 Views
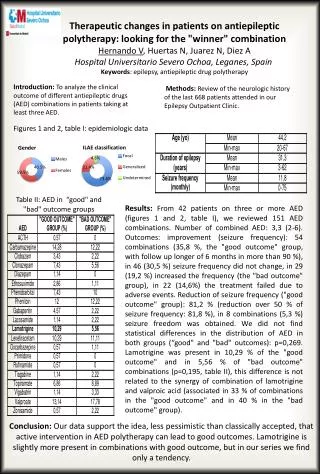
Epidemiologic Data Analysis and Validity. Joel Mefford meffordj@humgen.ucsf.edu. 01/27/2012. Data Analysis and Validity. Validity in Epidemiologic Studies Validity of Estimation Confounding Selection Bias Information Bias Generalizability Data Analysis Data Editing

E N D
Epidemiologic Data Analysis and Validity Joel Mefford meffordj@humgen.ucsf.edu 01/27/2012
Data Analysis and Validity • Validity in Epidemiologic Studies • Validity of Estimation • Confounding • Selection Bias • Information Bias • Generalizability • Data Analysis • Data Editing • Data Description and Summarization • Missing Values • Testing and Estimation • Multiple Comparisons
Validity in epidemiologic Studies Rothman, Greenland, and Lash: Ch. 9.
Validity in Epidemiologic Studies • Errors • Systematic errors => biases • Low bias => valid • Random errors • Low random errors => precise • Low total error ( systematic and random) => accurate • Validity of Estimation • Internal validity: validity of inferences based on an observation set when applied to the source population • External validity: generalizability of inferences to a population different or broader than the source population • Internal validity required for external validity
Validity in Epidemiologic Studies • Violations of internal validity: • Confounding • Selection bias • Information bias
Validity in Epidemiologic Studies Maclure and Schneeweiss (2001) Causation and bias: The episcope. Epi 12(1):114
Validity in Epidemiologic Studies • Confounding • Confounding as mixing effects • Confounders and surrogate confounders • Properties of a confounder • Confounders as extraneous risk factors • Judging the causal role of potential confounders • Criteria for confounding factors
Validity in Epidemiologic Studies • Confounding • Consider the situation where there is a causal path from an exposure of interest to disease (or whatever outcome of interest), but there is another causal pathway from an extraneous factor to disease. • If there is an association between the exposure of interest and the extraneous factor, then the effects of the extraneous pathway could be mistaken for the effects of the extraneous pathway.
Validity in Epidemiologic Studies • Confounding • Properties of a confounder • Associated with the outcome • If the exposure of interest really has an effect on the outcome, then any factor that happens to be associated with the exposure of interest could be associated with the outcome by virtue of the effect by the exposure of interest • Look for associations of potential confounders with the outcome, after accounting for the exposure of interest • A confounder should be associated with disease in the unexposed populations (no exposure of interest) • Associated with the exposure of interest, in source population of the cases
Validity in Epidemiologic Studies • Confounding • Criteria for confounding factors • A confounder must be an extraneous risk factor for disease • A confounder must be associated with the exposure under study in the population at risk from which the cases arise • A confounder can not be on the causal path from the exposure of interest to disease
Validity in Epidemiologic Studies • Selection Bias • Selection bias leads to invalid results because the observation set is not representative of the source population • Cicero, De Natura Deorum (and google translate) • observe from so many paintings, how many vows have escaped violence of the storm come in the harbor saved? • “Thus is made,” said he, "for they are never painted, who they have done in shipwreck and sea have perished.
Validity in Epidemiologic Studies • Selection Bias • In principle, you can correct for selection bias if you know or believe your models for the relative probabilities of selection for the observations that were collected, and no subgroups of the source population are excluded entirely.
Validity in Epidemiologic Studies • Selection Bias adjustment • Population based case-control study, (WCHS) • Effect of interest: oral contraceptive use -> stroke or MI • Auxiliary logistic regression models • used to estimate selection and • response probabilities: p_s, p_r • Observations weighted by (1/p_s)(1/p_r)
Validity in Epidemiologic Studies True values for simulation: p_1=3.706, p_2=16.59 Real data analysis:
Validity in Epidemiologic Studies • Selection Bias • Example: statistical adjustment for the population census. • Freedman and Wachter (2004) Methods for census 2000 statistical adjustment • An attempt was made to record who is living in the US, and where, in early 2000 • Analysis of official records (birth and death certificates, Medicare records, … ) suggest and undercount • The Accuracy and Coverage Evaluation Survey (ACE) attempted to carefully assess 25000 census blocks (~700k people). • ACE data broken into 448 demographic strata. • Over and undercounts of each stratum estimated by comparing raw census and ACE • Observations in raw census reweighted by over count ratio for the stratum corresponding to each observation • Analysts suggest that the adjusted counts are less accurate than the raw counts • After legal challenges, raw counts used for electoral reapportionment
Validity in Epidemiologic Studies • Information Bias • Measurement error, misclassification, and bias • Differential misclassification • Non-differential misclassification • Misclassification of confounders • Complexities of simultaneous misclassification
Validity in Epidemiologic Studies • Information Bias • Measurement error, misclassification • As a rule, continuous observations or measurements are made with some degree of error • Discrete or categorical observations are made with error as well. Error in observations of discrete variables is called misclassification
Validity in Epidemiologic Studies • Measurement errors can bias regression results • Hurcheon et al (2010) • BMJ 340:c7073 • Regression dilution bias
Validity in Epidemiologic Studies • Information Bias • Special terminology for misclassification of dichotomous variables: Sensitivity = Pr( report disease | true disease) Sensitivity = Pr( report exposure | true exposure) Sensitivity = Pr(event happens | predict that event will happen) Specificity = Pr(report no disease | truly no disease) Specificity = Pr(report no exposure | truly no exposure) Specificity = Pr(no event happens | predict that no event will happen)
Validity in Epidemiologic Studies • Information Bias: misclassification If you know the sensitivity and specificity for a classifier, you can work from their definitions to calculate the expected numbers of exposed and not exposed given the true numbers exposed and not exposed. Start by assuming a sensitivity (say 0.9) and specificity (say 0.95) and defining a vector of true counts v = [100, 100]:
Validity in Epidemiologic Studies • Information Bias: Misclassification Then define a matrix as follows:
Validity in Epidemiologic Studies • Information Bias: Misclassification Or based on the sensitivity and specificity given above: Call this matrix T. The expected counts of exposed and not exposed, based on the true counts of exposed and the transition matrix will be: verr = v * T
Validity in Epidemiologic Studies • Information Bias: Misclassification . matrix v = [100, 100]. . matrix T = [.9, .1\ 0.05, 0.95]. matrix list v v[1,2] c1 c2 r1 100 100 . matrix list T T[2,2] c1 c2 r1 .9 .1 r2 .05 .95 . matrix verr = v * T . matrix list verrverr[1,2] c1 c2 r1 95 105
Validity in Epidemiologic Studies • Information Bias: Misclassification Since the observed counts verr = v * T, we can recover the true counts v if we know or can assume T: 1: Use the matrix T to calculate its inverse Tinv 2: Multiply verr * Tinv = v * T * Tinv = v Stata: . matrix Tinv = inv(T) . matrix vadj = verr * Tinv . matrix list vadj vadj[1,2] r1 r2 r1 100 100
Validity in Epidemiologic Studies • Information Bias: Misclassification
Validity in Epidemiologic Studies • Information Bias • Differential misclassification • - the probabilities of misclassification (the sensitivities and specificities) for exposure are different for cases and controls • - the probabilities of misclassification for disease status are different for the exposed and unexposed • If the probabilities of misclassification of exposure do not depend of disease status; and the probabilities of misclassification of disease status do not depend on exposure status, then there is non-differential misclassification
Validity in Epidemiologic Studies • Information Bias: 1967. AJPH 57(12).
Validity in Epidemiologic Studies • Information Bias • Simultaneous misclassification • Misclassification of either (or both) exposure and disease • Misclassification of exposure and disease could be independent processes, or coordinated processes => dependent misclassification • Misclassification of confounders or other covariates • They may be misclassified alone or in combination with any of the other variables under consideration • This can all get rather complicated
Validity in Epidemiologic Studies • “non differential misclassification biases results toward the null”
Validity in Epidemiologic Studies • “non differential misclassification biases results toward the null” • The rule applies to expectations: you may expect observed effect measures to be pushed towards the null due to non-differential misclassification, but by dumb luck misclassification may yield results biased away from the null
Validity in Epidemiologic Studies • “non differential misclassification biases results toward the null” • The “rule” does not apply: • If categories have more than 2 levels • If observations are not independent • Even if there is non-differential misclassification of a dichotomous variable which biases results toward the null: • it is the effect estimate that is biased towards the null. The p-value is not necessarily biased towards larger values • Different studies with different measurement processes and sample sizes will have different levels of bias
Validity in Epidemiologic Studies • Tension between goals of study validity and generalizability • The better the study population represents the target population, the better results of the study will apply to the target population • Using a more restrictive study population may improve study validity • Studies can be restricted to be homogenous at suspected confounders • A well specified and accessible study population can be defined to limit selection bias, with respect to that study population
Epidemiologic Data Analysis Rothman, Greenland, and Lash: Ch. 13
Data Analysis • Data Editing • Sanity checks • Plot and/or tabulate the data • Are there outliers / nonsense values? • How much data is missing? How are missing values coded? • What are the units? Do you have a dictionary? • Recoding values • Categorization • Change of scale
Data Analysis • Data Description and Summarization • Choice of categories and data tabulation • Contingency tables require categorical variables • Choose brake points to split continuous variables into categorical variables • Depending on application, choose brake points based on percentiles, range, subject matter knowledge,… • Number of categories based on type of analysis you want to try, ease of communication • Avoid “empty cells” • “about 5 categories may often suffice” (RGL quoting Cochrane) • Classification time-varying covariates • person-time
Data Analysis • Missing values • Imputation • Fill in the blanks: mean values, KNN,… • Use auxiliary models and perhaps outside information to find fitting values for missing values • Use methods that handle missing or coarsened values • Models for survival data
Data Analysis • Imputation of genetic markers • Li et al (2009) Genotype Imputation. AnRev Genom Human Genet 10:387-406
Data Analysis • Testing and Estimation • Test statistics and p-values • Sensitivity and influence analysis • Continuity corrections and Mid-P values
Data Analysis • Test statistics and p-values • Test statistics are values that you can calculate based on a dataset • If the null hypothesis is true, you know or have an approximation to the distribution of the test statistic • If the observed test statistics would be surprising based on the null distribution, that counts as evidence against the null hypothesis • The statistical testing framework is designed to handle sampling variability well, but does not stand up to biases or incorrectly specified models • Directional versus absolute tests • P-values: how “surprising” is the observed test statistic?
Data Analysis • “upper one-tailed P-value for the observed test statistic is the probability that the statistic would be as high as observed or higher if the test hypothesis and validity conditions were correct” • “lower one-tailed P-value for the observed test statistic is the probability that the statistic would be as low as observed or lower if the test hypothesis and validity conditions were correct” • Consider lower P-values for directional tests (e.g. t-tests) and absolute tests (e.g. chi-squared tests). • Mendel’s peas
Data Analysis • Sensitivity and influence analysis • Influence Analysis • Are a small number of observations determining the conclusions of a data analysis • Leverage
Data Analysis • Sensitivity and influence analysis: • Sensitivity analysis: • How strongly do the results of a data analysis depend on particular choices made during the data handing and data modeling steps? • Definitions of variables? • Criteria for excluding observations? • Handing of missing data? • Methods of adjusting for confounders? • Statistical model? • Statistical methods / computational tools?
Data Analysis • Sensitivity and influence analysis: • Assessment: • Perhaps conduct your primary analysis as described in your analysis plan, then try some variations on the analysis and see if they point to the same conclusions • Example: • In the paper by Hegel et al. (2005) on skiers and helmets, they re-ran their regressions omitting each case-control matched set in turn and observed resulting change in the effect estimates. They then tried omitting the three most influential observation sets. • In R: library(robustbase). Provides MM-estimator alternatives to standard regression functions • In Stata: “robust” option for many functions. Specifies that standard errors are to be calculated using Huber-White sandwich estimator
Data Analysis MathWorks Cs.wellsley.edu
Data Analysis • Choice of test statistics • Do you know the distribution of the test statistic if the null is true? • If you know an approximation to the null distribution of the statistic, are there conditions under which the approximation breaks down? • Do you need to make assumptions beyond the null hypothesis to use the test statistic? • If the alternative hypotheses you are considering were true, would the test statistic have a very different distribution than under the null hypothesis? • Are tests or confidence intervals based on the test statistic “well calibrated” ? i.e. If the null were true, under repetition would the P-values be less than 0.05 five percent of the time? • Common Tweaks • Continuity corrections • mid-p-values
Data Analysis • Common Tweaks • Continuity corrections • If a test statistic is discrete, but you are using a continuous distribution to approximate its null distribution, consider calculating P-values based on values slightly different than the actual test statistic in order to account for the discrepancy between the discrete exact null distribution and the continuous approximate null distribution • mid-P-values: • Lower mid-P-value: the probability under the test hypothesis that a test statistic would be less than the observed value plus ½ the probability that it would equal the observed value
Data Analysis • Multiple Comparisons • If you conduct 100 statistical tests at alpha=0.05 significance levels, and the null hypothesis actually applies in all cases, you can expect (0.05)*100 = 5 false positives • Joint confidence interval: • In the scenario above, what is the probability that all 100 of the 95% confidence intervals will contain the null value? • (0.95)^100 = 6% • How can we make a confidence intervals corresponding to each of the 100 tests such that under the null they would all cover the null value 95% of the time: • Use alpha* = alpha/100 = 0.05/100 • (1-alpha*)^100 = 0.9512 • If you conduct the 100 statistical tests at significance level alpha*, and the null hypothesis applies in all cases, you can expect (0.05/100)*100 = 0.05 false positives. • This is the Bonferonni method for controlling family-wise error rate – the probability of a false positive result across a whole set or family of results