Download
1 / 11
110 likes | 243 Views
Ch 1. The Profession of Transp. Engineering. Lecture Objectives:. Know that transportation is a derived demand Understand that the quality of transportation services will affect the economic growth Be able to identify some of the social benefits and costs of transportation

E N D
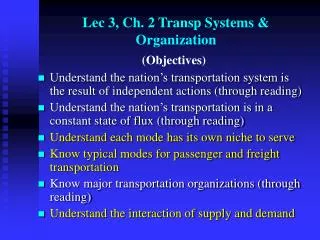
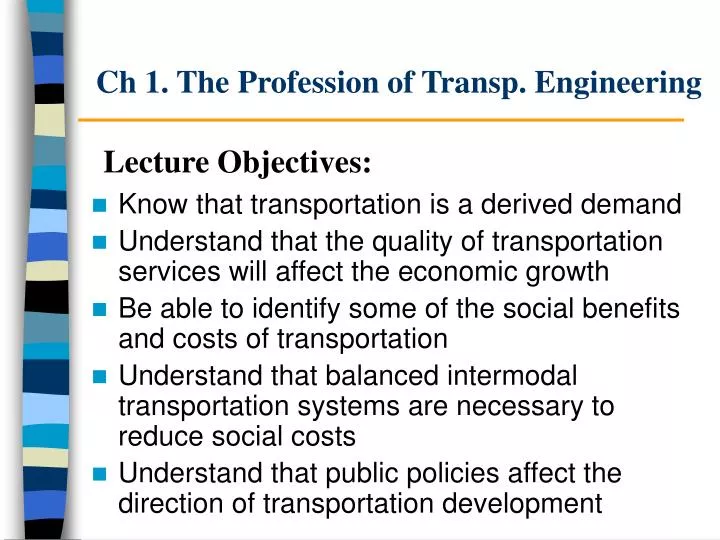
Ch 1. The Profession of Transp. Engineering Lecture Objectives: • Know that transportation is a derived demand • Understand that the quality of transportation services will affect the economic growth • Be able to identify some of the social benefits and costs of transportation • Understand that balanced intermodal transportation systems are necessary to reduce social costs • Understand that public policies affect the direction of transportation development
Transportation and Economic Growth • Couple of statements in page 4 help you understand why providing excellent transportation services are essential for a country. • Good transportation, in and of itself, will not assure success in the market place; however, the absence of excellent transportation services will contribute to failure. • Transportation is a necessary condition for human interaction and economic survival. • Transportation is a necessary element of government services such as delivering mail, defending a nation, and retaining control of its territories. • Transportation systems are developed and built to ensure easy mobilization of armies in the event of a national emergency.
Producers – Transportation Networks – Consumers(Essential links) LA Osamu Corp. NYC Daikich Sushi Tuna - the Philippines Salmon – Chile Shrimp - Indonesia Based on an article in the Daily Herald, 8/21/00
Social Costs and Benefits Need for a Balanced Intermodal System Breakdown of livable communities Services to rural areas Environmental Disruption (Air, water, noise) Expanded mobility Freeway as an example Expanded economic activities Divided communities Loss of lives Faster delivery of goods and services Loss of lands Congestion and delay Loss of the natural beauty UDOT, I-15/I-215 Interchange
Transportation in the U.S.The major contributor to its GNP Transport Bill as % of the GNP See page 5 of the text for recent values Source: Transportation in America, 1993, Eno Foundation
Highway travel consumes a lot of petroleum Fuel, oil, asphalt 1993: Total=6.23 billion barrels Source: Transportation in America, 1993, Eno Foundation
Other Facts • Over 80% of eligible drivers have driver’s licenses (185 millions in 1998). About 208 million registered vehicles. Population About 270 millions. (This is probably one reason why so much money is pumped into highways. But is it alright to ignore 20% of the people who are eligible but not able to have licenses? Remember they do pay taxes. Gasoline taxes are used basically for construction of new roads. They are not enough for maintaining/operating highways. They come from other general taxes.) • Travels an average of 12,000 miles/year • Transportation industries employ over 11% of work force 14.3 million people in transportation industries in 1998 (11.1% of total employment)
Why automobile travel surged? • Public policies favored automobile travel • Successful lobbying by special interests • Large public investments (subsidies) in highway travel and a miniscule amount of public investments in public transit • Unrealistically low out-of-pocket costs (Drivers do not think of the true cost of driving a car.)
Are drivers really paying enough? UD = User direct costs UF = User fixed costs SS = Subsidies SC = Social costs EC = Environmental costs Vuchic, “Transportation for Livable Cities,” p.236
Recent Trend • Management of the existing facilities • Less new constructions of highways • Reinvestment in public transit (TRAX for instance) • Intermodalism • Reduction of vehicle kilometers (miles) of travel – VKT or VMT – and delays due to congestion • Intelligent Transportation Systems • Coordination of land use and transportation network
Example of intermodalism in our community (in the near future…)