Download
1 / 26
260 likes | 332 Views
Sea Level Rise and Ecosystem Services of Tidal Marshes. Steven Pennings, University of Houston In collaboration with: Chris Craft, Indiana University (PI) Samantha Joye, University of Georgia Dick Park, Jon Clough, Eco Modeling Jeff Ehman, Image Matters.

E N D
Sea Level Rise and Ecosystem Services of Tidal Marshes Steven Pennings, University of Houston In collaboration with: Chris Craft, Indiana University (PI) Samantha Joye, University of Georgia Dick Park, Jon Clough, Eco Modeling Jeff Ehman, Image Matters U.S. EPA Science to Achieve Results (STAR) program
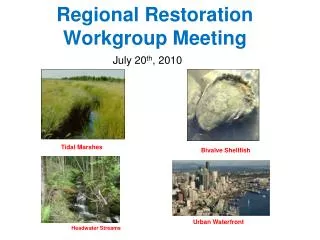
Ecosystem services • Shoreline protection • CO2 and CH4 fluxes • Retention of carbon, nitrogen, phosphorus • Support of higher trophic levels
GCE LTER Sapelo Sound Sapelo Island Doboy Sound Altamaha Sound
Altamaha Ogeechee Satilla Tidal fresh Tidal brackish Tidal marine EPA: Three estuaries Two sites/salinity level/estuary, n=18 sites
Land Sea Tidal fresh-water marsh Salt marsh Regulation Functions Shoreline Protection CO2 & CH4 Flux Carbon sequestration N&P retention Sediment Deposition Denitrification Habitat Functions Macrophyte Diversity Marsh Nekton Productivity Functions Macrophyte ProductivityMarshNekton Predictions largely based on William E. Odum 1988
Research Questions • How will rising sea level affect abundance • and distribution of tidal wetlands AND • their delivery of ecosystem services? • How will climate variability (precipitation, • temperature, etc.) affect delivery of ecosystem services?
Research Questions • How will rising sea level affect abundance • and distribution of tidal wetlands AND • their delivery of ecosystem services? • How will climate variability (precipitation, • temperature, etc.) affect delivery of ecosystem services?
I. Sea Level Rise • Quantify ecosystem services of salt, brackish • and tidal fresh marshes. • Overlay ecosystem services on GIS map of • wetlands. • Simulate different scenarios of sea level rise to • predict change in wetland area, type and • ecosystem services.
Quantify ecosystem services of salt, brackish and tidal fresh marshes • Soil deposition • C, N and P sequestration in soils and macrophytes • CO2 and CH4 fluxes from soils • Macrophyte primary production and diversity • Nekton biomass and diversity
Simulate different scenarios of sea level rise--marsh accretion • Marshes rise in elevation as sediment is deposited and new roots are produced and die • Accretion can be measured using several techniques (feldspar layers, SET, lead or cesium dating of cores) • Accretion is taken into account in our projections using cesium dating accretion estimates from GCE sites
SLAMM Version 5 (Sea Level Affects Marshes Model) SLAMM uses elevation, NWI, tide range and historic sea level rise data to parameterize the model. The simulation is run using A1B SRES (mean) scenario.
2050 1986 2075 2100
Net Change (1986-2100) Wetland Area C Sequestration (ha) (MT/yr) --------------- -------------- Tidal fresh-3,500 -4,200 (120 g C/m2/yr) Brackish marsh +400 +480 (120 g C/m2/yr) Salt marsh -5,400 -1620 (30 g C/m2/yr)
Caveats • Projected changes in marsh type may not be perfect • Marsh accretion rates may increase as marshes submerge • Nevertheless, this work is novel because it will combine projections of area change with ecosystem service estimates • Further simulations can explore areas of uncertainty
II. Climate Variability Identify relationships between climate forcing functions (annual rainfall, temperature, discharge, salinity) and… temporal variation in ecosystem services (emergent biomass, epifauna, sediment deposition, accretion/subsidence and commercial shrimp harvest). (GCE LTER monitoring data, NMFS data)
Summary • Sea level rise will change the area of different types of tidal marshes • Different types of tidal marshes provide different levels of ecosystem services • By combining estimates of both area and services, we hope to forecast how net marsh ecosystem services will change with rising sea levels and changing climate • Work is in progress, stay tuned for results, we’d be happy for your input