Download
1 / 22
220 likes | 290 Views
Development of Flux Capabilities & Recent developments at the Borden Forest Research Station Ralf Staebler. This presentation: Fluxes 101 The Borden Forest Research Station Ongoing & planned flux work.

E N D
Development of Flux Capabilities & Recent developments at the Borden Forest Research Station Ralf Staebler
This presentation: • Fluxes 101 • The Borden Forest Research Station • Ongoing & planned flux work
Frequently we are actually interested not just in the concentrations, but the fluxes (i.e. what goes in and out of the box at the atmosphere’s lower boundary) • Measuring the fluxes is typically an order of magnitude more difficult (in terms of instrument requirements) • Options: • Eddy Covariance • Gradient methods (aerodynamic, modified Bowen Ratio & variants) • (Relaxed) Eddy Accumulation • Chambers • Mass-balance techniques (integrated horizontal flux, horizontal mass difference,…) • Hybrid measurement/modeling methods (Lagrangian dispersion)
Frequently we are actually interested not just in the concentrations, but the fluxes (i.e. what goes in and out of the box at the atmosphere’s lower boundary) • Measuring the fluxes is typically an order of magnitude more difficult (in terms of instrument requirements) • Options: • Eddy Covariance • Gradient methods (aerodynamic, modified Bowen Ratio & variants) • (Relaxed) Eddy Accumulation • Chambers • Mass-balance techniques (integrated horizontal flux, horizontal mass difference,…) • Hybrid measurement/modeling methods (Lagrangian dispersion)
Difference between true Eddy Accumulation and Relaxed Eddy Accumulation: EA: , where fis a flowrate proportional tow (proportionality factor B) REA: , using a fixed flowrate, proportionality factor A
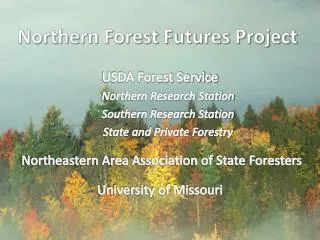
What makes Borden useful? • Close-to-ideal conditions for flux measurements (horizontal homogeneity, large fetch) • Large patch of forest representative of southern Ontario (Great-Lakes-St. Lawrence Mixed Forests) • Close to agricultural and urban sources (advection time ~ a few hours or less interesting chemistry at detectable levels) • Long historical record of measurements • Conveniently close to Downsview and Egbert (ideal for cost-effective development work)
Location Borden
Borden Flux Tower - History 1985 detailed site characterization construction of first 45m tower (den Hartog, Neumann) 1986 Turbulence profiles (den Hartog, Neumann, Shaw) LAI study (Neumann) 1988 EMEFS I (Eulerian Model Evaluation Field Study) 1990 EMEFS II 1993 BOREAS preparation (den Hartog, Neumann, Fuentes, Staebler, Black, Thurtell) 1995 Isoprene Study (Fuentes), Radiative transfer (Staebler) Roughness Sublayer Gradients (Simpson) 1995-2003continuousflux measurements: CO2, H2O, H (33m) met:Wind speed & dir (33m, 45m) T & RH (33m, 45m) T profile (12 levels) radiation: shortwave in & out, PAR, net since July 98: PAR out, PAR at 2m soil: 2 T profiles (6 levels) 2 moisture profiles (6 levels) soil heat flux (2 sites) 2004 Construction of new tower, modernization & refurbishment for further research 2004-? Pollutant flux work
The last few days of the old tower (Jan’04) The old tower
Infrastructure: • New 41m tower • New 9x13’ instrument hut at the base (11m2) • Electricity: 200 Amp Service • 10x30’ main trailer (28m2) • Additional lab space: (25m2) • Storage space: (31m2)
41m Wind Speed & Dir., PAR, Solar Radiation, T, RH 33 m CO2, H2O, sensible heat & momentum Fluxes, Shortwave up & down, Longwave up & down, reflected PAR,T, RH 33m T, CO2, H2O 29m T 25m T, CO2, H2O 22.6m T 19.6m T 17.8m CO2, H2O 16.5m T 13.5m T 10m T, CO2, H2O 6.3m T 5m CO2, H2O 1.4 m Bole T 3.3m T CO2, H2O, sensible heat & momentum fluxes, PAR 1.5m T, CO2, H2O Soil T (2,5,10,20,50,100 cm) Soil moisture (2,5,10,20,50,100 cm) Soil heat flux (5 cm) Not shown: Leaf wetness (0.9, 2, 10, 17.7, 23.8 m) The “basic” tower system:
Network Link To Windows PC 3D Sonic #1 RS-232 lines Data Acquisition Hardware Links Licor #1 3D Sonic #2 Licor #2 23X PC, Linux Operating System Cyclades Multi-Serial Port Met Logger Tprof Logger Soil Logger etc.
Data Acquisition Software Links Serial Stream Capture Programs ("robot") Software links Transient data file (*.ttyC0) Transient data file (*.ttyC0) Transient data file (*.ttyC0) SSCP #1 Display Programs SSCP #2 Transient data file (*.ttyC1) "Robot #1" "Robot #1" "Robot #1" "Robot #2" "Robot #1" "Robot #1" "Robot #1" Analysis Program (bordenrere): - averaging - mean removal - moments - crossproducts - power spectra - covariance spectra - autocorrelation functions - crosscorrelation functions Transient data file (*.ttyC2) "Robot #1" "Robot #3" "Robot #1" "Robot #1" SSCP #3 "Robot #1" "Robot #1" "Robot #1" Merger Program "rtm" Raw Data Files (*.rwb) Transient data file (*.ttyC3) SSCP #4 Transient data file (*.ttyC1) Transient data file (*.ttyC0) Transient data file (*.ttyC0) Transient data file (*.ttyC0) Transient data file (*.ttyC0) Transient data file (*.ttyC0) Transient data file (*.ttyC0) Transient data file (*.ttyC4) SSCP #5 Analysis Output Files ("*.bin”) Transient data file (*.ttyC5) "Robot #3" "Robot #1" "Robot #1" "Robot #1" "Robot #1" "Robot #1" SSCP #6 "Robot #1" . . .
Forest fluxes of NH3, SO2, O3 – why should we care? • CE business line: “understanding … the environmental and human health threats posed by toxic substances and other substances of concern.” • Forests cover 66% of Ontario • Forest health affected (ozone damage; acidification; eutrophication) • Dry deposition important process in regional air-quality models • Interesting chemistry at the atmosphere/forest interface (esp. so close to pollutant source regions)
Current dry deposition short-comings: • Most current dry deposition parameterizations based on scant measurements of O3 and SO2 • Resistances for all other species are usually estimated based on linear combinations of the physical characteristics (solubility, reactivity) of O3 and SO2 • Very limited data on NH3 compensation points in forests • Not much continuous data on intra-seasonal variability of deposition velocities • Spotty understanding of the detailed physics of exchange processes How we plan to improve AURAMS & CHRONOS: • Measure fluxes of O3, SO2and other compounds • Provide intra-seasonal, continuous fluxes of key species • Provide compensation points • Provide insights into processes through simultaneous, high time resolution measurements of fluxes and environmental controlling parameters • Provide details on co-deposition of O3, NH3 and SO2
Current extra measurements: First EC fluxes of NH3 over a forest, with Guelph TGA
What’s Next: Winter 2004/05: assembly and lab testing of fast O3 sensor and denuder-based REA system Spring/Summer 2005: field testing of REA and O3 systems (4-8 weeks), more TDL NH3 flux measurements Summer/Fall 2005: Evaluation of results; development of quasi-real-time REA system with in-situ analyzers Initial modeling activities Fall/Winter 2005: Report on first field intensive Down the road: • Modification of REA system to include HNO3,NO2 … • Aerodyne AMS at Borden: aerosol fluxes • PTR-MS: biogenic VOC fluxes