Download
1 / 37
370 likes | 474 Views
Diabetes and Carcinoma. Dominique SIMON Service de Diabétologie – Hôpital de la Pitié – Paris et INSERM U-780 – Villejuif dominique.simon@psl.aphp.fr. Diabetes – Cancer connections. Diabetes/high BG level and cancer mortality/incidence : epidemiological data

E N D
Diabetes and Carcinoma Dominique SIMON Service de Diabétologie – Hôpital de la Pitié – Paris et INSERM U-780 – Villejuif dominique.simon@psl.aphp.fr
Diabetes – Cancer connections • Diabetes/high BG level and cancer mortality/incidence : • epidemiological data • putative mechanisms/diabetes treatment • Pancreatic cancer and diabetes • Influence of cancer on diabetes and vice versa
Epidemiological data Japanese population (1) • 97,771 Japanese subjects (47.3% males) • 40-69 yrs old ; age = 51.6±7.9 yrs at baseline in 1990-4 • Average follow-up : 10.7 yrs (up to 31 December 2003) • Diabetic patients: 6.7% in males ; 3.1% in females • 6,462 cases of newly diagnosed cancer (3,907 in males and 2,555 in females) Inoue M et al. Arch Intern Med 2006; 166 : 1871-7
MEN All sites : 1.27 (1.14-1.42) Liver : 2.24 (1.64-3.04) Pancreas : 1.85 (1.07-3.20) Kidney : 1.92 (1.06-3.46) Colon : 1.36 (1.00-1.85) Stomach:1.23 (0.98-1.54) Prostate: 0.82 (0.51-1.33) All HR adjusted for age, BMI, tobacco, alcohol and vegetables consumption, physical activity WOMEN All sites : 1.21 (0.99-1.47) Stomach : 1.61 (1.02-2.54) Liver : 1.94 (1.00-1.85) Ovary: 2.42 (0.96-6.09) Pancreas: 1.33 (0.53-3.31) Breast: 0.83 (0.44-1.57) Inoue M et al. Arch Intern Med 2006; 166 : 1871-7 Epidemiological data Japanese population (2)HR for Cancer in diabetic patients
Epidemiological data Swedish population (1) • 64,597 Swedish non diabetic subjects (48.5% males) • 40-60 yrs old ; age=46.1±9.8 yrs at baseline since 1985 • Average follow-up : 8.3±3.6 yrs • FPG and 2-h PG measured : 5.4±1.0 and 6.6±1.7 mM • FPG : normal=87%; IFG=10.5%; diabetes=2.5% • 2-h PG : normal=93%; IGT=6%; diabetes=1% • 2,478 cases of newly diagnosed cancer (46.5% in males) • RR for top quartile vs bottom quartile of FPG and 2-h PG Stattin P et al. Diabetes Care 2007; 30 : 561-7
MEN(all sites) FPG : 1.08 (0.92-1.27) ptrend= 0.25 2-h PG : 0.98 (0.84-1.16) ptrend= 0.99 After exclusion of prostate cancer : FPG : 1.12 (0.92-1.36) ptrend= 0.16 2-h PG : 1.17 (0.95-1.45) ptrend= 0.095 RR unchanged after adjustment for BMI and tobacco consumpt. WOMEN (all sites) FPG : 1.26 (1.09-1.47) ptrend< 0.001 2-h PG : 1.31 (1.12-1.52) ptrend< 0.001 After correction for random variation PG : FPG : 1.75 (1.32-2.36) ptrend< 0.001 2-h PG : 1.63 (1.26-2.18) ptrend< 0.001 Stattin P et al. Diabetes Care 2007; 30 : 561-7 Epi Swedish population (2)RR for Cancer (top/bottom quart.)
FPG Pancreas : 2.49 (1.23-5.45) ptrend= 0.006 Mal. melan. : 2.16 (1.14-4.35) ptrend= 0.01 Ur. tract : 1.69 (0.95-3.16) ptrend= 0.049 Endometr. : 1.86 (1.09-3.31) ptrend= 0.019 Prostate : 0.96 (0.74-1.26) ptrend= 0.71 RR unchanged after adjustment for BMI and tobacco consumption 2-h PG Pancreas : 0.91 (0.47-1.78) ptrend= 0.91 M. mel. : 1.65 (0.89-3.17) ptrend= 0.09 Ur. tract : 1.18 (0.65-2.17) ptrend= 0.78 Endom. : 1.82 (1.07-3.23) ptrend= 0.03 Prostate : 0.79 (0.61-1.02) ptrend= 0.07 Stattin P et al. Diabetes Care 2007; 30 : 561-7 Epi Swedish population (3)RR for Cancer (top/bottom quart.)
Other epidemiological data (1) Korean study • 1,298,385 subjects (63.9% males) • Age = 46.9±11.5 yrs with 9.4 yrs of follow-up • 53,833 incident cancers (70.1% in males) • HR* in top (≥ 7.8 mM) vs bottom (<5.0 mM) FPG in men and women respectively : • all cancers incidence = 1.22 (1.16-1.27) and 1.15 (1.01-1.25) • all cancers mortality = 1.29 (1.22-1.37) and 1.23 (1.09-1.39) • pancreatic cancer death = 1.91 (1.52-2.41) and 2.05 (1.43-2.93) • liver cancer death = 1.57 (1.40-1.76) and 1.33 (1.01-1.81) • colon cancer death = 1.31 (1.03-1.67) (only in men) *unchanged with adjustment for BMIJee SH et al. JAMA 2005; 293: 194-202
Other epidemiological data (2)Austrian study • 140,813 subjects (45.2% males) • Age = 43±15 yrs with 8.4±3.8 yrs of follow-up • 5,212 cases of cancer • HR* in top (≥ 7.0 mM) vs reference (4.2-5.2 mM) FPG : - for all cancers incidence = 1.20 (1.03-1.39) in men and 1.28 (1.08-1.53) in women - for liver cancer = 3.56 (1.58-8.02) in combined sexes - for gallbladder and bile duct cancer incidence = 3.35 (1.16-9.70) in combined sexes *adjusted for age, BMI, smokingRapp K et al. Diabetologia 2006; 49: 945-52
Association of diabetes/high B G level and risk of cancer • Increased risk (~ +20%) of all cancers incidence and mortality in diabetic patients and non diabetic subjects with higher glucose level • Increased risk of digestive cancers (pancreas, liver, stomach, colon) in diabetic patients and non diabetic subjects with higher glucose level • Decreased risk of prostate cancer in diabetic patients [meta-analysis : HR = 0.91 (0.87-0.95)*] *Bonovas S et al. Diabetologia 2004; 47: 1071-8
Diabetes Cancer
Diabetes • Behavioral factors • Diet • Physical activity • Adiposity Cancer
Diabetes • Metabolic factors • Insulin • IGF • Cytokines, hormones • Behavioral factors • Diet • Physical activity • Adiposity Cancer
Putative mechanisms for cancer- diabetes association (prostate excluded) • Both reflects common exposure (diet high in fats and energy, low in fibers; low level of physical exercise) • Reduced insulin sensitivity with compensatory hyperinsulinemia and elevated levels of IGF-1 stimulation of cell proliferation • Insulin activates IGF-1 receptor, known to have growth-promoting effects • Excess insulin down-regulates the level of IGF-BP1 increase in the IGF-1 availability to the IGF-1 receptor
Putative role of diabetes treatment in the development of cancer – Saskatchewan Health database(1) • Population-based cohort study ~ 1,000,000 subjects • Compared cancer-related mortality according to new treatment by OAD or insulin in type 2 diabetic patients • Cancer mortality over 5.4±1.9 yrs of follow-up : • 4.9% in sulfonylurea monotherapy users • 3.5% in metformin users (3.3% in monotherapy) • 5.8% in insulin users (vs 3.6% without insulin) • HR for cancer death in SU vs metformine = 1.3 (1.1-1.6) and insulin vs no insulin = 1.9 (1.5-2.4) Bowker SL et al. Diabetes Care 2006; 29: 254-8
Putative role of diabetes treatment in the development of cancer (2) • Limitations of the Saskatchewan study1 : • observational data and clinicians’ prescibing could be affected by cancer • no information on glycaemic control, BMI, smoking status… • no information on cancer incidence • DARTS pilot observational study2 : • case-control study using a population-based databases on 314,127 subjects including 11,876 T2D patients 923 K • adjusted* for any exposure to metformine = 0.77 (0.64-0.92) • dose-response relationship HR for this effect • reduction of cancer risk with metformine via AMPK/LKB1 ? • limitations : observational; influence of K on clinicians’prescribing ? 1Bowker SL et al. Diabetes Care 2006; 29: 254-8 2Evans JMM et al. BMJ 2005; 330: 1304-5 *adjusted for BMI,BP, smoking
Putative mechanisms for prostate cancer- diabetes association • Reduced insulin response in diabetic patients ? • Commun factor increasing the risk of diabetes and decreasing the risk of prostate cancer : obesity inducing a decrease in androgens level ? • rather good evidence from animal models • low testosterone level in diabetic and obese patients
T2 diabetes and pancreatic cancer • Meta-analysis of 36 (17 case-control and 19 prospective) studies by Huxley • = 1.82 (1.66-1.99) • Influence of diabetes duration on : 2.1 (1.9-2.3) if < 5 yrs vs 1.5 (1.3-1.8) if ≥ 5 yrs* • Reverse causality in part : diabetes can be an early manifestation of pancreatic cancer • No evidence to screen for pancreas K in Diab. * p = 0.005 Huxley R et al. Br J Cancer 2005; 92: 2076-83
Diabetes after cancer • Decreased physical activity • Increased sarcopenic adiposity • Higher diabetes risk once cancer occurs
Cancer after diabetes • Higher morbidity with Rx • Higher mortality • Higher recurrence (breast) • Worsening of diabetes control as an alert signal for cancer
Impact of PG level on cancer risk • Swedish study1: - absolute risk of any cancer over 20 yrs in a woman in the bottom vs top quartile of FPG : 7% and 9% respectively (7% and 11% after correction for random FPG variation) - fraction of all cancers attributable to a high level of PG : 5% (95% CI = 2-8%) for FPG and 4% (1-8%) for 2h-PG [10% (7-15%) and 9% (6-15%) after correction] • Korean study2 : 802/20,566 cancer deaths in men and 46/5907 in women estimated to be attributable to “high” FPG level (≥ 90 mg/dl) 1-Stattin P et al. Diabetes Care 2007; 30 : 561-7 2-Jee SH et al. JAMA 2005; 293: 194-202
Conclusions • Moderate increase (~ +25%) of cancer risk in diabetic patients, mainly digestive cancers • To reduce cardiovascular complications remains the priority in diabetic patients • Obesity is a common risk factor for diabetes and cardiovascular disease but also, directly, for cancer • To prevent obesity is the major Public Health concern at the present time
Obesity, Physical Activity WHO estimates 20% of cancers caused by obesity, lack of physical activity International Agency for Research on Cancer, 2003
Obesity and cancer mortality The Cancer Prevention Study II • Prospective study begun in 1982 in the US • 404,576 men and 495, 477 women ≥ 30 yrs • 16 yrs of follow-up • Mean age = 57 yrs at enrollment • 216,000 deaths including 57,145 deaths from cancer (32,303 in men) • RR all cancer mortality in subjects with BMI ≥ 40 kg/m2 vs those with 18.5 < BMI < 24.9 kg/m2 : • 1.52 ( 95% CI = 1.13 – 2.05) in men • 1.62 ( 95% CI = 1.40 – 1.87) in women E. E. Calle et al. NEJM 2003; 348: 1625-38
Cancer Mortality and BMI, Men 1.3 Prostate (> 35) 1.5 1.5 Non-Hodgkin’s lymphoma (> 35) All Cancers (> 40) 1.7* All other cancers (> 30) 1.7 Kidney (> 35) 1.7 1.8 Multiple myeloma (> 35) Gall bladder (> 30) 1.8 Colon &Rectum (> 35) Esophageal (> 30) 1.9* 1.9 Stomach (> 35) 2.6* Pancreas (> 35) 4.5 Liver (> 35) Relative Risk and 95% CI * RR for men who never smoked E. E. Calle et al. NEJM 2003; 348: 1625-38
Cancer Mortality and BMI, women 1.4 1.5 Colon &Rectum (> 40) 1.5 Multiple myeloma (> 35) Ovarian (> 35) 1.7 1.9* Liver (> 35) 2.0 All Cancers (> 40) 2.1 Non-Hodgkin’s lymphoma (> 35) 2.1 Breast (> 40) 2.5* Gall bladder (> 30) 2.6* All other cancers (> 40) 2.8 Esophageal (> 30) 3.2 Pancreas (> 40) 4.8 Cervix (> 35) 6.3 Kidney (> 40) Uterus (> 40) Relative Risk and 95% CI * RR for women who never smoked E. E. Calle et al. NEJM 2003; 348: 1625-38
Obesity and cancer • Major risk factor - both men and women • Post menopausal breast • Endometrial • Colorectal • Esophageal • Liver • Renal • Prostate (advanced disease at higher obesity levels)
Obesity and cancer • Major risk factor - both men and women • Post menopausal breast • Endometrial • Colorectal • Esophageal • Liver • Renal • Prostate (advanced disease at higher obesity levels) Associations with diabetes independent of obesity
Physical activity and DM • Protective for both men and women • Overlaps with obesity • Improves insulin sensitivity
Physical activity and cancer • Protective for both men and women • Overlaps with obesity • Apparent independent benefits for breast and colon cancer
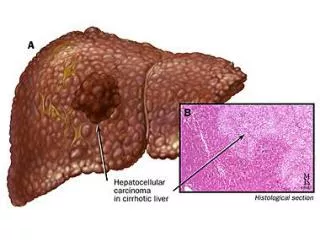
Liver cancer and diabetes • Shared obesity factor • Fatty liver • Cytokines • Cholestasis
Cancer recommendations DM recommendations CHD recommendations
Policy opportunities for reversing the obesity epidemic • Convergence of evidence for cancer, heart disease, diabetes - Though the fear of single diseases may be more motivating than fear of collective diseases • Collaboration across disease- specific governmental and NGO groups • ACS, AHA, ADA partnership