Download
1 / 17
170 likes | 300 Views
Virginia ADAP Data Report December 2008. Anne Giuranna Rhodes Department of Epidemiology and Community Health Virginia Commonwealth University. ADAP Summary: October 2007 to September 2008. Total clients served 3281 (3339) Average cost per prescription – $417 ($308)

E N D
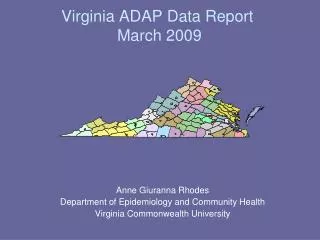
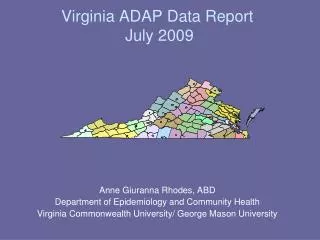
Virginia ADAP Data Report December 2008 Anne Giuranna Rhodes Department of Epidemiology and Community Health Virginia Commonwealth University
ADAP Summary:October 2007 to September 2008 • Total clients served 3281 (3339) • Average cost per prescription – $417 ($308) • Cost per person per month - $1,263 ($1,062) • Number of new clients –616 (738) • Clients accessing anti-depressants – 305 (0) • Avg. length of time on ADAP (months) – 51.4 (31.9) * Numbers in parentheses are from 4 years ago (Oct 2003 to Sept 2004)
Value of Filled Prescriptions • *Note: Value is not reduced by a) Medicaid back-billing reimbursements, • b) Year-end General funds, c) Pharmaceutical company rebates and free goods, • d) Re-dispensing of medications that are dispensed but not picked up
Part B Consortia and VA ADAP:Race/Gender – April 2008 to Sept 2008
Active Clients by Region – September 2008(n=2798) Southwest has seen largest decline in clients over the past 3 years
New and Continuing Clients by Age: Oct 2007 to Sept 2008 • New clients significantly younger, with the average age of clients new to ADAP in the last year = 39.7 years compared to 44.3 for those continuing on ADAP • 13.7% of continuing clients are over 55, while only 9.0% of new clients are in this age group
New and Continuing Clients - MedicationsOct 2007 to Sept 2008 • New clients not receiving any HepC treatment • New clients more likely to receive anti-anxiety and anti-psychotics, but not anti-depressants • Continuing clients more likely to receive vaccines, but overall vaccines appear to be underutilized
New and Continuing Clients - # of ARVsJuly 2008 to Sept 2008
New and Continuing Clients – Total Number of DrugsJuly 2008 to Sept 2008 • Average number of drugs 4.5 for new clients, 4.4 for continuing clients • New clients more likely to get 1 drug only and over 6 drugs
Utilization of New Formulary Drugs:October 2007 to September 2008 Antihyperglycemics Antilipidemics 103 persons $ 22,591 238 persons $ 144,855 Anti-depressants Anti-anxiety 305 persons $ 48,936 36 persons $ 691 Anti-psychotics Bi-polar treatment 34 persons $ 45,035 5 persons $ 241
New Classes of Drugs: Persons by MonthOctober 2007 to September 2008