Download
1 / 50
500 likes | 634 Views
U.S. Army Corps of Engineers Great Lakes Tributary Modeling Program 516(e). Landuse BMP Discussion & SWAT (Soil Water Assessment Tool) Workshop June 22, 2011 Graham S. Hayes SUNY @ Buffalo. Workshop Outline. Welcome, Introductions & Objectives Introduction to BMPs

E N D
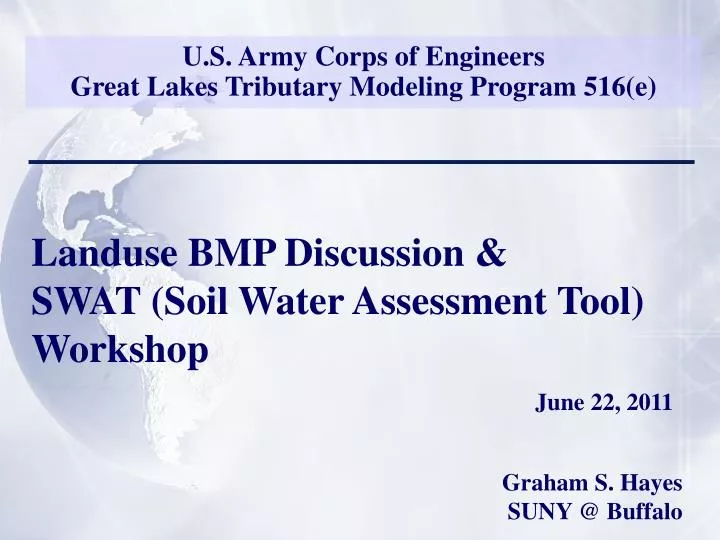
U.S. Army Corps of Engineers Great Lakes Tributary Modeling Program 516(e) Landuse BMP Discussion & SWAT (Soil Water Assessment Tool) Workshop June 22, 2011 Graham S. Hayes SUNY @ Buffalo
Workshop Outline • Welcome, Introductions & Objectives • Introduction to BMPs • Modeling BMP Scenarios • Selecting Appropriate BMPs • Expected BMP Modeling Outcomes • Summary
Welcome, Introductions & Objectives • Graham S. Hayes • Research Scientist / Assistant Director • LESAM Laboratory within the National Center for Geographic Information & Analysis (NCGIA) • Geography Department State University of New York (SUNY) at Buffalo, Buffalo, NY • 30 yrs of programming and hands-on GIS experience.
LESAM Laboratory • Landscape-based Environmental Systems Analysis & Modeling Laboratory • A collaborative interdisciplinary research laboratory that links the following research centers of excellence:
LESAM Implementation Goals: Supporting • Continuous research and development • Assessing historic test cases • Risk mapping efforts • Classes, courses, and workshops • Managing data quality to model everyday and extreme events • Practical solutions to real world situations • Provide fast response to emerging situations
Community Resilience Research to establish a holistic framework for defining and measuring disaster resilience for communities at various scales Seven dimensions of community resilience have been identified, and are represented by the acronym P E O P L E S Renschler, Frazier, Arendt, Cimellaro, Reinhorn, and Bruneau (2010) Developing the ‘PEOPLES’ Resilience Framework for Defining and Measuring Disaster Resilience at the Community Scale, EERI.
P E O P L E S
BMP Discussion Objectives • Discuss the factors which lead to erosion. • Discuss the benefits of controlling erosion. • Discuss the ability to model erosion & BMPs. • Discuss a range of feasible erosion control BMPs. • Choose a narrow range of BMPs which can be represented, simulated and modeled. • Schedule our next discussion regarding the BMP scenario models.
Workshop Outline • Welcome, Introductions & Objectives • Introduction to BMPs • Modeling BMP Scenarios • Selecting Appropriate BMPs • Expected BMP Modeling Outcomes • Summary
What Causes / Impacts Erosion? • Soil Composition • Slope • Rain • Soil moisture • Vegetative cover • Leaf litter • Volume of runoff
Worst Case Scenario for Erosion? • Dry unconsolidated soil • Steep slopes • Sparse vegetation • No leaf litter • Heavy rain • High volume of runoff
Best Case Scenario for Erosion? • Cohesive soils • Gentle slopes • Vegetative cover • Leaf litter • Moist soil • Moderate rainfall • Low runoff volumes
Why Model Erosion ??? • Cheaper and faster than causing major rain storms and resultant flooding… • Can compare field observations to model results. • Can apply “what if” scenarios to test theories and concepts. • Can account for multiple factors which contribute to erosion.
Sed. Yield with Soil and Water Assessment Tool (SWAT) Preliminary Results
Sed. Yield with Soil and Water Assessment Tool (SWAT) Preliminary Results
Sed. Yield with Soil and Water Assessment Tool (SWAT) Preliminary Results
Sed. Yield with Soil and Water Assessment Tool (SWAT) Preliminary Results
Flow Yield with Soil and Water Assessment Tool (SWAT) Preliminary Results
Flow Yield with Soil and Water Assessment Tool (SWAT) Preliminary Results
Flow Yield with Soil and Water Assessment Tool (SWAT) Preliminary Results
Flow Yield with Soil and Water Assessment Tool (SWAT) Preliminary Results
Flow Yield with Soil and Water Assessment Tool (SWAT) Preliminary Results
What can we Best Manage in Practice ??? • Rain – no • Soil moisture – no • Cash crops – somewhat, but not directly • Tillage practice – somewhat, but not directly • Physical lay of the land – somewhat, but not directly
Workshop Outline • Welcome, Introductions & Objectives • Introduction to BMPs • Modeling BMP Scenarios • Selecting Appropriate BMPs • Expected BMP Modeling Outcomes • Summary
Modeling BMP Scenarios • Better understand the sources of sediment yield within the Cattaraugus Creek watershed • Engage stakeholders in knowledge transfer and encourage better landuse practices to reduce soil erosion and deposition at the mouth of Cattaraugus Creek into Lake Erie. • Combine and compare the results from 3 process-based models for runoff, sediment yield and flooding. • Focus on the Clear Creek sub-basin within the Seneca Nation of Indians’ Territory.
Avg. Annual Soil Loss simulated with GeoWEPP - the Geospatial Interface for the Water Erosion Prediction Project
Best Management Practices Sediment Yield at Outlet BMP (cons. tillage) vs. No-BMP (conv. tillage) 1.0 ton acre-1 yr-1 vs. 5.6 ton acre-1 yr-1
Modeling Land Use Change • The following slides illustrate the result of a Spatial Analyst tool called Expand which allows the user to select grid cells with specific attributes or land use classifications and have those regions grow by a set number of cells.
Spatial Analyst Expand Tool By running this tool iteratively, changes in specific landuse classes can be simulated to test a range of spatial value changes over time.
Workshop Outline • Welcome, Introductions & Objectives • Introduction to BMPs • Modeling BMP Scenarios • Selecting Appropriate BMPs • Expected BMP Modeling Outcomes • Summary
BMP Objectives • Understand the natural processes and social issues at play within the Clear Creek sub-basin. • Use established baseline models to illustrate average and peak runoff and sediment yield numbers for the sub-basin. • Investigate alternative agricultural practices to model changes in sediment yield and runoff based on simulated BMPs.
BMP Model Limitations • Models are limited by the size of the watershed. • Models are limited by the resolution of the data (e.g. a 5 m wide buffer strip would be “lost” in a 30 m grid cell). • Models are limited by the design of the algorithms operating in the background. Data availability is outstripping the legacy logic. • Many factors go into making sediment move, we understand and model only a few.
BMP Considerations ? Conservation Tillage Buffer Strips Contouring Farming Cover Crops Landuse Change ? ? ? ? ? ?
Workshop Outline • Welcome, Introductions & Objectives • Introduction to BMPs • Modeling BMP Scenarios • Selecting Appropriate BMPs • Expected BMP Modeling Outcomes • Summary
Desired Outcome from BMP Selection • Modify underlying model input data to simulate BMP scenarios • Crop rotation and tillage practices • Contour farming • Vegetative buffer strips • Landuse change over time • Run models using BMP scenarios • Conduct workshop to share BMP scenario model results
Workshop Outline • Welcome, Introductions & Objectives • Introduction to BMPs • Modeling BMP Scenarios • Selecting Appropriate BMPs • Expected BMP Modeling Outcomes • Summary
Summary • Making the models understandable; and getting those models into the hands of the stakeholders is key to the success of this project. • We have a strategy for effective outreach • We have interchangeable modeling tools • We have the teaching and learning modules in place • We have a robust integrated approach to community outreach and holistic measurements (PEOPLES) • Online tools to encourage collaboration and effective project management (GeoProMT)
BMP Discussion Summary • Discussed the factors which lead to erosion. • Discussed the benefits of controlling erosion. • Discussed the ability to model erosion & BMPs. • Discussed a range of feasible erosion control BMPs. • Chose a narrow range of BMPs which can be represented, simulated and modeled. • Scheduled our next discussion regarding the BMP scenario models.