Download
1 / 19
200 likes | 338 Views
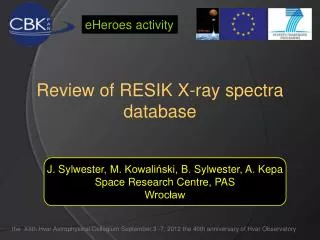
eHeroes activity. Flare Differential Emission Measure from RESIK and RHESSI Spectra. B. Sylwester , J. Sylwester , A. Kępa Space Research Centre, PAS, Wrocław , Poland T. Mrozek Astronomical Institute, Wrocław University, Poland Space Research Centre, PAS, Wrocław , Poland

E N D
eHeroesactivity Flare Differential Emission Measure from RESIK and RHESSI Spectra B. Sylwester, J. Sylwester, A. Kępa Space Research Centre, PAS, Wrocław, Poland T. Mrozek Astronomical Institute, Wrocław University, Poland Space Research Centre, PAS, Wrocław, Poland K.J.H. Phillips Mullard Space Science Laboratory, Dorking, UK
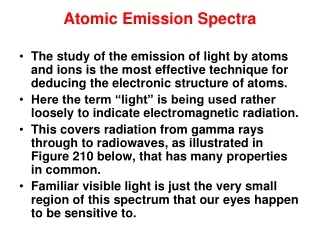
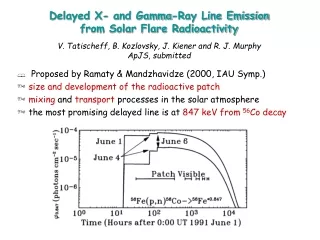
RESIK We present the results of differential emission measure (DEM) analysis of flaring plasma. The analysis is based on the X-ray spectra obtained with Polish-led spectrometer RESIK on Russian CORONAS-F satellite. RESIK is the uncollimated bent crystal spectrometer consisting of two double-channel X-ray spectrometers. It was designed to observe solar coronal plasmas in four energy bands. The nominal wavelength coverage of RESIK is 3.3 Ǻ – 6.1 Ǻ. Recorded spectra contain many spectral lines formed in H- and He-like ions of various elements. The line and continuum is formed in hot coronal plasma from the T-range 3 MK ÷ 30 MK in various proportions for different spectral bands. This makes RESIK spectra uniquely suitable for investigations of the temperature structure of the source (DEM) as well as the plasma elemental composition.
The Differential Emission Measure (DEM) For optically thin, mulithermal plasma: DEM characterizes the amount of plasma at various temperatures present in the source. DEM ≡ Φ(T) ≡ Ne2 is non-negative Fi measured fluxes obtained from RESIK spectra in i=15 spectral bands fi(T) calculable theoretical emission functions for every spectral band used, CHIANTI 7.0 atomic code has been used in this respect Ai assumed elemental abundance taken as constant over the source volume
DEM inversion From reduced absolute RESIK spectra we have selected 15 narrow spectral bands embracing the most intense lines and the continuum below. We determined the time-changing fluxes in these bands for flares selected in this research. These fluxes constitute the input set for the differential emission measure (DEM) inversion FiΦ(T). The theoretical fluxes have been calculated using the CHIANTI 7.0 code (http://www.chiantidatabase.org) with appropriately selected plasma composition – representative (optimum) for each selected event for the elements: Ar, S, Si, and adopting coronal values (following Feldman, 1992) for other elements, except for K and Cl, for which RESIK values were used (last slide of previous talk). In the spectral calculations, the ionization equilibrium of Bryans, Landi & Savin (ApJ, 691, 2009) has been adopted. For the inversion, the Withbroe-Sylwester iterative algorithm representing the maximum likelihood approach (Solar Phys., 67, 1980) has been used. The inversions have been carried out over the temperature range 3 MK - 30 MK. 10 000 iterations were performed on each inversion run in the accelerated scenario. The inversion uncertainties were determined from 100 Monte Carlo exercises, where the input fluxes for time-frame of interest were randomly perturbed with corresponding measurement uncertainties.
The emission (contribution) functions ∆λ [Å] 3.40 3.62 K XVIII triplet ch #1 3.62 3.80 Ar XIII Lyaα ch #1 3.90 4.07 Ar XVII triplet ch #2 4.11 4.25 S XV 1s2-1s4p + satellites ch #2 4.35 4.43 SXIV 3p satellites 4.43 4.52 Cl XVI 1s2-1s2p triplet + satellites 4.68 4.75 SXVI 1s-3p Lyα 4.74 4.80 Si XIV 1s-5p Lyδ 5.00 5.15 S XV 1s2-1s2p triplet + satellites 5.25 5.34 Si XIII 1s2-1s5p 5.34 5.48 Si XIII 1s2-1s4p+ 5p sat 5.48 5.62 Si XII 4p satellites 5.64 5.71 Si XIII 1s2-1s3p 5.71 5.86 Si XII 3p satellites 5.92 6.00 Continuum
Flare SOL2002-12-26T08:30 GOESC1.9 http://www.cbk.pan.wroc.pl/resik_catalogue.htm Spectral nights as seen by optical satellite sensor. Dark grey areas denote times of radiation belts passages – High Voltage is turned OFF. We selected 13 timeintervals ∆t=75s ÷ 200s durationcoveringthis part of evolution of the event
Spectralvariability for SOL2002-12-26T08:30 ∆t = 75÷200 sec
DEM examples: SOL2002-12-26T08:30 For each selected time interval 10 000 iterations for DEM inversion have been performed. Typically, better than 5 % agreement between observed and DEM predicted fluxes in every spectral band is reached.
Results of DEM inversionareverysensitiveto the assumedplasmacomposition!!! With identical set of inputfluxes, the inversionoutcomesarequitedifferent for particularpatterns of plasmacomposition Coronalabundances Photosphericabundances For the set of coronal and photospheric composition patterns the ratios of observed and DEM-predicted fluxes in individual spectral bands exceed 15% and 20% respectively. Overall inversion convergence is worse, if at all observed. This is in contrary to the situation when the event-optimised pattern of abundances is used as is the case for the present study.
DEM evolutionfor SOL2002-12-26T08:30 Total & cooler GOES Hot T>9 MK Hot T>9 MK
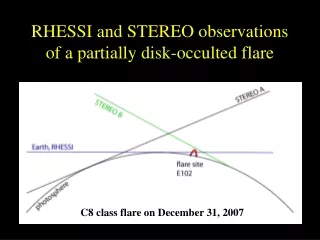
RHESSI for SOL2002-12-26T08:30 D=4.5 x 108 cm If we consider the total EM of the hot component to be contained in the RHESSI bright kernel, this allows for the estimation of the densityof hot plasma.
We selected 14 time intervals ∆t= 6.5 min.÷ 21 min. SOL2003-02-15T08:10 C4.5 Event-averaged spectrum
DEM evolution for SOL2003-02-15T08:10 Total GOES T>9 MK
Relativeproportion of hot and coldplasma The highest proportion of hot plasma is at the time of RHESSI 12-25 keV maximum.
RHESSI for SOL2003-02-15T08:10 Changingmorphology of hot component Plasmadensityislower in thisevent
Concludingremarks • DEM distributions have been calculated using absolutely calibrated RESIK spectra. 15 spectral bands are identified in the range 3.3 Å -- 6.1 Å for the DEM inversion. • Adjusting the plasma composition is apparently necessary before the DEM inversion (otherwise, the outcome results in biased solutions). • For two flares, the DEM distributions have two components – a cooler component T < 9 MK (probably related to the non-flaring active region) and ahotter one T > 9 MK (flare proper). • The total EM of the hotter component is orders of magnitude less than that of the cooler component and declines rapidly in the flare later stages. • The presence of this tiny amount of hot plasma is nevertheless necessary in the data analysis for the observed fluxes in several spectral bands to be reproduced. • With the emitting region size from imaging instruments like RHESSI, a lower limit for the density of plasma can be estimated: typically this is near 1011 cm-3 near the flare peak.