Download
1 / 34
340 likes | 465 Views
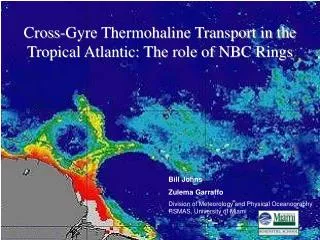
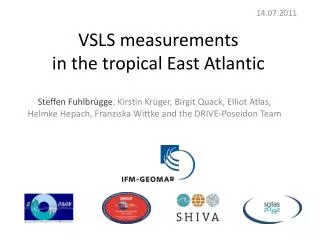
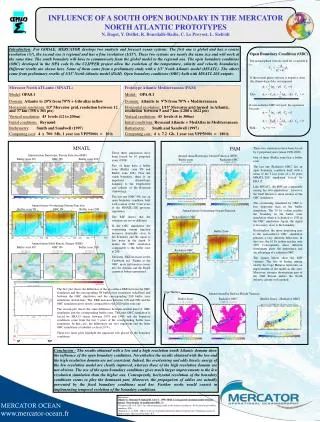
Western boundary circulation and the role of deep eddies in the tropical South Atlantic. Marcus Dengler Friedrich Schott, Peter Brandt, Jürgen Fischer, Lothar Stramma Carsten Eden, Rainer Zantopp, Karina Affler Leibniz-Institut für Meereswissenschaften, Kiel, Germany. Overview

E N D
Western boundary circulation and the role of deep eddies in the tropical South Atlantic Marcus Dengler Friedrich Schott, Peter Brandt, Jürgen Fischer, Lothar Stramma Carsten Eden, Rainer Zantopp, Karina Affler Leibniz-Institut für Meereswissenschaften, Kiel, Germany • Overview • Western Boundary Circulation (Schott et al. 2004) -shipboard sections at 5°S (8 sections) and 11°S (4sections)-moored observations at 11°S (2000-2003) • Deep Western Boundary Current Eddies • Summary Tropical Atlantic Workshop, June 2004
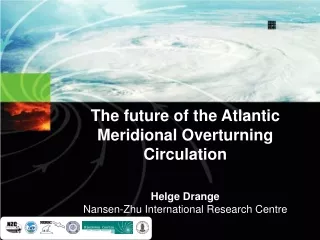
8 sections Array 2000-2004 (gaps!) 4 sections Observational program (1990-2004)
BoundaryCirculation in the tropical South Atlantic Mean salinity at 11°S and transport layer distinction
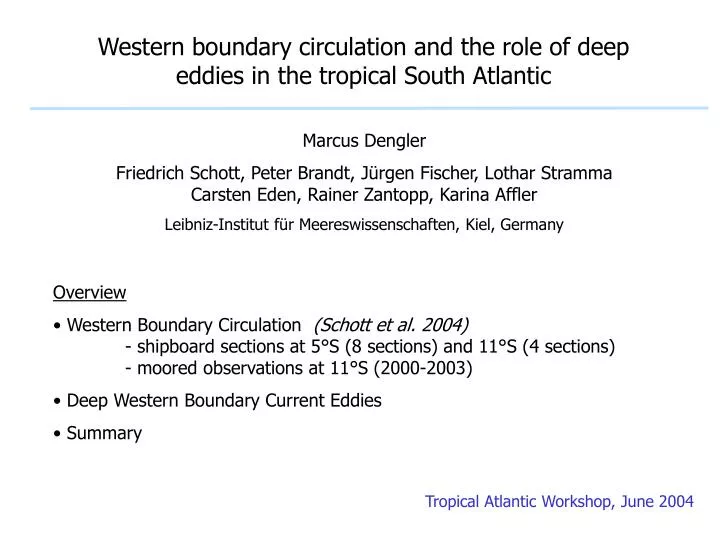
BoundaryCirculation at 5°S (8 Sections, 1990-2003) Along-shore LADCP/ADCP velocity sections from 5°S • NBUC always at shelf edge • DWBC sometimesreversed at slope • (new LADCP post-processing method)
BoundaryCirculation at 5°S (8 Sections, 1990-2003) • NBUC=26.8 Sv • 14.3 Sv in SACW layer • offshore southward AAIW layer flow (5.2 Sv) • net upper21.5 Sv • DWBC= -28.1 Sv • upper NADW -14.7Sv • m/l NADW -5.3Sv • net NADW -20.0 Sv • AABW = 1.3 Sv • Section total almost closed (10%)
BoundaryCirculation at 11°S (4 Sections, 2000-2003) • NBUC welldeveloped • AAIW counter current • Large NADW transports and counter currents
BoundaryCirculation at 11°S (4 Sections, 2000-2003) • NBUC = 23.3 Sv • 12.1 Sv in SACW layer • southward offshore flow at AAIW level • net upper 21.2 Sv • DWBC = 41.2 Sv • 18.2 Sv return offshore • net NADW -23.0 Sv • AABW = 1.4 Sv • Section nearly balanced (<1Sv). • Theat = 1.0 PW Tfresh = - 0.2 Sv
Budget of upper circulation <24.5 24.5-26.8 26.8-32.15 total (Sv) 5°S sectionboundary 3.7 13.3 8.8 26.8 Offshore -- .2-5.1 -4.9 net 3.7 13.9 3.0 20.6 11°S sectionboundary 1.5 12.19.7 23.3 Offshore -.4 1.1-2.6 -1.9 net 1.1 11.0 7.1 19.2 • NBUC already fully established at 11°S (i.e. is part of the STC) • Box 5-11°S requires westward flow in upper layer (but upper 20m uncertain due to extrapolation) and eastward flow in AAIW layer (300-1200m) • EUC layer (main STC carrier): little inflow from east: good site!! • Offshore southward flow in AAIW layer!
Budget of upper circulation 5°S section and AAIW-layer circulation in 1/12° Miami model _ NBUC retroflection supplies_ recirculation Courtesy of Z. Garaffo and E. Chassignet
Western boundary circulation and the role of deep eddies in the tropical South Atlantic Marcus Dengler Friedrich Schott, Peter Brandt, Jürgen Fischer, Lothar Stramma Carsten Eden, Rainer Zantopp, Karina Affler Leibniz-Institut für Meereswissenschaften, Kiel, Germany • Overview • Western Boundary Circulation (Schott et al. 2004) -shipboard sections at 5°S (8 sections) and 11°S (4sections)-moored observations at 11°S (2000-2003) • Deep Western Boundary Current Eddies • Summary Tropical Atlantic Workshop, June 2004
100m level (large gaps) Moored observations at 11°S (2000-2003)
1900m level Southward „DWBC“ aliasing during ship section times Moored observations at 11°S (2000-2003)
Moored observations at 11°S (2000-2003) Mean section and boxes (1-6) for time series Box transports (Sv) 1: 12.52: 2.83. 9.84: 2.71-4: 27.8 (NBUC)(Ship NBUC was 23.3) 5:-3.0 (+0.7):(AAIW recirculation, -2.6 from ship obs. ) 6: -18.7 (DWBC)(ship mean was –44 Sv) 1 2 4 3 5 6
Moored observations at 11°S (2000-2003) NBUC transport variability (box 1-4) • current records mapped using EOFs from all time series • mode 1+2 explains NBUC variability strong variability on different time scales
Moored observations at 11°S (2000-2003) DWBC transport variability (Box 6) strong intraseasonal variability
Moored observations at 11°S (2000-2003) Annual and semi-annual cycle of transport time series • Significant seasonal (semi+annual) cycle of NBUC and DWBC • explains lower NBUC transport from ship-board observations • NBUC variability at 11°S may be(partially) caused by SEC bifurcation migration (pers. comm. S. Huettl)
Moored observations at 11°S (2000-2003) Interannual differences and trends 2000-2003 Annual averages: Time NBUC 3/00-3/01 23.6 3/01-3/02 23.7 3/02-3/03 26.4 NBUC Line fit: 1.5 Sv/year
Moored observations at 11°S (2000-2003) Correlation of NBUC and DWBC transport with alongshore currents of array Variability in the upper ocean is not correlated to deep ocean variability.
Western boundary circulation and the role of deep eddies in the tropical South Atlantic Marcus Dengler Friedrich Schott, Peter Brandt, Jürgen Fischer, Lothar Stramma Carsten Eden, Rainer Zantopp, Karina Affler Leibniz-Institut für Meereswissenschaften, Kiel, Germany • Overview • Western Boundary Circulation (Schott et al. 2004) -shipboard sections at 5°S (8 sections) and 11°S (4sections)-moored observations at 11°S (2000-2003) • Deep Western Boundary Current Eddies • Summary Tropical Atlantic Workshop, June 2004
Deep Western Boundary Current Eddies along-shore velocity Structure of DWBC similar to counter current structure
Deep Western Boundary Current Eddies Salinity distribution and contours of along-shore velocity DWBC and offshore countercurrents carry same water masses Oxygen distribution and contours of along-shore velocity
Deep Western Boundary Current Eddies 50-90d band-pass filtered time series • EKE maximum largest at 1900m (K3,K4) and 2400m (K5) • Maxima away from continental slope
Deep Western Boundary Current Eddies 50-90 day band pass filtered velocities at 1900m (2400m) depth along-shore velocity cross-shore velocity Sequence of anti-cyclonic sub-mesoscale eddies (about 6 per year) Dengler et al., DSR, 2004
LACDP data Eddy fit - eddy translation Eddy fit to mooring data Eddy model based on Gaussian-shaped density distribution alongshore component: across-shore component: as array is one-dimensional 2000m
Eddy fit to mooring data Eddy model fit: min • Data: • 14 velocity time series • 40h low-pass data • 40-80 day ensembles _Explained Variance 46% fit failed for two ensembles
Average eddy parameters Eddy translation Along-shore = 3.8 cm/s Cross-shore = 2.1 cm/s 3.9 cm/swestward drift > CR(3. mode)= 2.6 cm/s 1.8 cm/s southward drift _ _eddy translation not explainable by advection only
Average eddy parameters Eddy scale Amplitude (gaussian)= 0.50 m/sRadius (e folding) = 60 kmEddy offshore center = 160 km Height (e folding) = 1100 mDepth of maximum = 2100 m
Eddy Volume Average eddy parameters average Volumeeddy= (13.9 +/- 5.9) x 1013 m3 DWBC- Volumeeddy= (10.5 +/- 3.6) x 1013 m3 (depth range: 1200-3800m)
Eddy Transport Box 6 transport from eddy sequence (-)and moorings (--) Transport: Box 6 (moorings) = -14.2 Sv Eddies Box 6 = -15.2 Sv total eddy DWBC transport (1200-3800m) = -17.9 Sv DWBC array seesrectified eddy mean! - eddy scales could not be determined
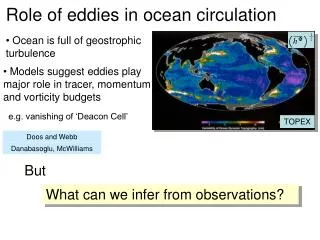
Eddy kinetic energy and mean kinetic energy at 1900m from FLAME model Deep Western Boundary Current Eddies in Models • FLAME Model • 1/12° resolution • Domain: 18°S-70°N, 100°W-16°E • setup includes open boundary at 18°S EKE distribution similar to distribution from 1/6° OPA model. (Trequier et al., JPO, 2003) DWBC-EKE at 11°S only slightly enhanced in 1/12° Miami model.
Deep Western Boundary Current Eddies in Models FLAME Model eddy kinetic energy along 10°S Deep EKE maximum similar to observations Snapshot of along-shore and across-shore velocity
Deep Western Boundary Current Eddies in Models Velocity vectors and density perturbation • Model suggests eddy generation near 8°S. • Continental slope turns sharply to the west.
Summary • Upper layers • NBUC - average transport: at 5°S from 8 sections: 26.8 Sv, at 11°S from moorings: 27.8 Sv - 13 Sv as part of STC - SEC bifurcation well south of 11°S - stable NBUC core at 5-11°S - strong annual and semi-annual transport variability - significant interannual differences in NBUC (linear trend: 1.5 Sv/year) - relation to STC variability? - how much near boundary vs. interior? (in Pacific: interior variability partially compensated by wbc) • AAIW-Layer - offshore southward recirculation (5 Sv) - how does it connect? - Miami model: NBUC retroflection - - 800m RAFOS show inflow from east
Summary • Deep circulation • DWBC transports at 5-11S - at 5°S (8 sections): net southward flow –20 Sv -at 11°S (4 sections): section net –23 Sv- DWBC transport from eddies: about–18 Sv • DWBC Eddies- 5-6 DWBC eddies per year(similar to NBC rings) - carry water masses of the DWBC southward - westward translation agrees with eddy dynamics (southward translation?) - FLAME simulation indicate: - generation at ~7-8°S - eddy size correlates with upstream DWBC transport - eddy existence implies no „classical DWBC“ south of °S