Download
1 / 64
650 likes | 1.17k Views
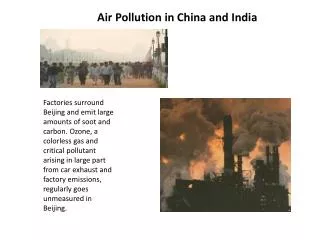
Outdoor Air Pollution and Population Health in China. Haidong Kan, M.D., Ph.D. School of Public Health, Fudan University Shanghai, China kanh@fudan.edu.cn. 5th International Conference on Environmental and Occupational Medicine Apr. 9, 2010. Outline. Ambient air pollution levels in China

E N D
Outdoor Air Pollution and Population Health in China Haidong Kan, M.D., Ph.D. School of Public Health, Fudan University Shanghai, China kanh@fudan.edu.cn 5th International Conference on Environmental and Occupational Medicine Apr. 9, 2010
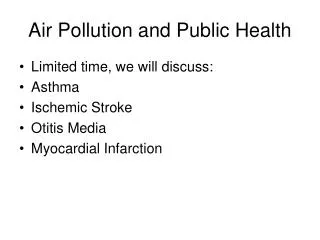
Outline • Ambient air pollution levels in China • Air pollution epidemiologic studies in China • Health burden of air pollution in China • Co-benefits of GHGs reduction in China • Summary
Outline • Air pollution levels in China
Estimated PM10 Concentration in World Cities (pop=100,000+) Source: World Bank
Annual PM10 levels in 30 provincial capitals of China (μg/m3,2004)
Comparison of the PM10/SO2/NO2 levels in Chinese cities and International/National Air Quality Standards (annual average) Kan et al, CVD Prevention & Control, 2009
Fine particle: PM2.5 Comparison of the PM2.5 levels in Shanghai, Beijing and International/National Air Quality Standards Kan et al, Env Int, 2007; Guo et al, Sci Total Environ, 2009
Energy production and emissions of SO2 and dust in China, 1998 - 2008 Zhang et al, Lancet, 2010
Outline • Air pollution epidemiologic studies in China
A summary of air pollution epidemiologic studies in China Short-term exposure studies: Time-series/case crossover studies Single-city analysis: Beijing, Hong Kong, Shanghai, Shenyang, Taiyuan, Wuhan, etc. Multi-city analysis: PAPA, CAPES Panel study: Beijing Long-term exposure study Cross-sectional study: several Cohort study: ONE only Intervention study Beijing Olympics Hong Kong
Short-term exposure: Time-series Public Health and Air Pollution in Asia (PAPA) Shanghai Wuhan Hong Kong Bangkok http://www.healtheffects.org/international.htm
Results: comparison between PAPA cities PM10: Health effects Levels BK had the biggest but less precise ER than the others Wong et al, EHP, 2008
Traffic-originated particles has the largest health hazard! % Increase in Daily Deaths by Specific PM2.5 Sources: Six Cities Study (1979-1988)1 1 % increase in daily deaths associated with 10 ug/m3 increase in mass concentration from source; Laden et al, EHP, 2000. 1 % increase in daily deaths associated with 10 ug/m3 increase in mass concentration from source; Laden et al, EHP, 2000.
Results: comparison between PAPA cities SO2: Health effects Levels Similar ERs across cities, but less precise in BK Wong et al, EHP, 2008; Kan et al, Env Res, 2010
Results: comparison between PAPA cities NO2: Health effects Levels Wong et al, EHP, 2008
Results: comparison between PAPA cities O3: Health effects Levels Wong et al, EHP, 2008
PM10, concentration-response curve WHO AQG China National Standard II
Public Health and Air Pollution in Asia (PAPA) Short-term exposure: Time-series Shanghai Wuhan Hong Kong Bangkok http://www.healtheffects.org/international.htm
CAPES China Air Pollution and Health Effects Study A new multi-city time-series study in Mainland China Supported by China Ministry of Environmental Protection PIs: Haidong Kan and Bingheng Chen Short-term exposure: Time-series
CAPES cities 沈阳 乌鲁木齐 鞍山 太原 天津 西安 上海 杭州 桂林 福州 广州
Spatial Distribution of Emissions in China, 2005 SO2 NOx PM10 VOCs PM2.5 CO
Short-term exposure Panel study Association of Heart Rate Variability in Taxi Drivers with Marked Changes of Particulate Air Pollution in Beijing in 2008 Wu et al, EHP, 2009
Short-term exposure PM10: PM2.5 vs. PM10-2.5 • Among PM10, • PM2.5: significant effects on daily mortality; • PM10-2.5: NO significant health effects Kan et al, Environ Int, 2007
Short-term exposure Interaction between pollutants • Higher PM10 significantly increased the effect of O3 on total mortality; • O3 also increased the effect of PM10. Chen et al, Biomed Environ Sci, 2007
Short-term exposure Visibility and mortality risk Huang et al, Sci Total Environ 2009
Modifiers of air pollution acute health effects Season: warm vs. cool Gender: male vs. female Age SES Short-term exposure Sensitive sub-population Kan et al, EHP, 2008
Warm (May-Oct) and cold (Nov-Apr) seasons Short-term exposure Kan et al, EHP, 2008
Short-term exposure Warm (May-Oct) and cold (Nov-Apr) seasons Cao et al, Sci Total Environ, 2009
Female vs. male Short-term exposure Kan et al, EHP, 2008
Young vs. old Short-term exposure Kan et al, EHP, 2008
Educational level: a measure of SES Short-term exposure Kan et al, EHP, 2008
Long-term exposure: cross-sectional Air pollution and mortality in Beijing Zhang et al, Sci Total Environ, 2000
Long-term exposure: cross-sectional Air pollution and lung cancer in Guangzhou Tie et al, Atmos Environ, 2009
Long-term exposure: cohort study CNHS Air Study • China National Hypertension Survey (CNHS) • Baseline survey in 1991 • Follow-up visit in 1999 • 158,666 participants in 17 provinces of China (including both urban and rural areas) • CNHS Air: a retrospective cohort analysis of outdoor air pollution and mortality in China • 90,167 urban participants in 41 Chinese cities
Long-term exposure: cohort study Previous findings from the CNHS He et al, NEJM, 2005 Gu et al, JAMA, 2006 Gu et al, NEJM, 2009
Long-term exposure: cohort study CNHS Air cities Outdoor air pollution levels (in 1991-1993, μg/m3)
Long-term exposure: cohort study CNHS Air Results • Each 10 μg/m3 increase in TSP was associated with increased risk of death *: • 0.2% for total mortality (p=0.222) • 0.8% for cardiovascular mortality (p=0.003) • 0.4% for respiratory mortality (p=0.448) • 1.0% for lung cancer mortality (p=0.095) * After adjustment for age, gender, smoking (smoking status, age at starting smoking, years smoked, and cigarettes per day), alcohol intake, physical activity, education, hypertension
CNHS*: 10 μg/m3 increase of PM2.5 was associated with 0.6%↑ of total mortality 2.5%↑ of cardiovascular mortality 1.2%↑ of respiratory mortality 3.1%↑ of lung cancer mortality *: assuming PM2.5/PM10≈0.65 and PM10/TSP ≈0.5 ACS:10 μg/m3 increase of PM2.5 was associated with 4%↑ of total mortality 6%↑ of cardiopulmonary mortality 8%↑ of lung cancer mortality Long-term exposure: cohort study Comparison with the ACS study Pope et al, JAMA, 2002
Long-term exposure: cohort study Strengths and limitations of CNHS Air • Strengths • Large sample size • Detailed individual information on potential confounders • Limitations • TSP only • Air pollution exposure on the aggregated city level, rather than individual level
Intervention study Health benefits gained from environmental intervention • Hong Kong • Dublin • Atlanta • Beijing Olympics
1988 1989 1990 1991 Hong Kong: air pollutants 1988 – 95 80 HALF YEARLY MEAN LEVELS PM10 Fuel restriction on sulphur 60 NO2 50% reduction in SO2 after the intervention SO2 40 Micrograms per cubic metre O3 20 No change in other pollutants Hedley et al 2002 0 1992 1993 1994 1995 Year
ReductionsIn Deaths After Sulfur Restriction 0 -1 -1.6% -2 -1.8% -2.4% % Reduction in annual trend -3 -2.8% -4 -4.2% -5 -4.8% -6 15-64 65+ 15-64 65+ 15-64 65+ All causes Cardiovascular Respiratory
Typical air pollution in Beijing Good air quality during the Beijing Olympics
Intervention study Li et al, Sci Total Environ, 2010
Outline • Health burden of air pollution in China
Chinese burden of disease from top 10 risk factors plus selected other risk factors Outdoor air pollution Smith et al., 2005. Derived from WHO data