Download
1 / 45
450 likes | 701 Views
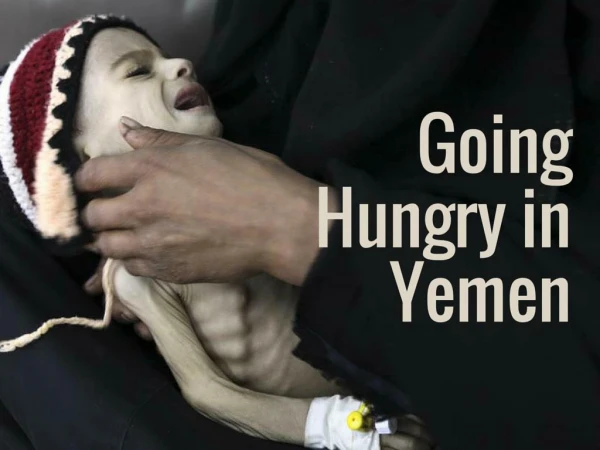
Economics of Malnutrition: Combating Malnutrition in the Inter-generational Context. Veena S Rao. Introduction. India , today is one of the most malnourished countries in the World.

E N D
Economics of Malnutrition: Combating Malnutrition in the Inter-generational Context Veena S Rao
Introduction • India, today is one of the most malnourished countries in the World. • More than 40% of the World’s under weight childrenbelow five years live in India (Global Hunger Index 2007) • The latest NFHS 3 asserts that not much progress has been achieved in improving human resources. • Poverty is a major, but not the only cause of malnutrition • Percentage of population suffering from various forms of malnutrition, far exceeds the percentage below poverty line • After National Nutrition Policy 1993 and National Plan of Action, 1995 no national programs or policies for eradicating malnutrition have appeared. • Today, India has no national programme to combat malnutrition
Indicators for Assessing the Nutritional Status Indirect Indicators • Access to Hygenic Sanitation and Toilet Facilities • Access to Safe Drinking Water • Female literacy Direct Indicators • Low Birth Weight • Infant Mortality Rate (IMR) • Under 5 Mortality Rate (U5MR) • Stunting/ Wasting/ Underweight • Anaemia • Immunization • Maternal Mortality Rate (MMR) • Chronic Energy Deficiency and Anaemia among adults
Nutritional Status of Men in India Male malnutrition intrinsically begins with maternal malnutrition 28.1% of the men in India have Body Mass Index below normal Stunted stature and low body weight of men due to malnutrition results in Chronic Energy Deficiency 24.3% of the men in India are anaemic Anaemia reduces work capacity and results in low productivity Percentage of men suffering from anaemia ranges from 7.1% in Kerala to 44.6% in Assam Percentage of men having below normal BMI and suffering from anaemia is higher in SC and ST population. 5 5 Cont…
Economics of Malnutrition Prof RW Fogel: NBER Working Paper 16- Conquest of High Mortality and Hunger in Europe and America:Timings and Mechanisms “The first law of thermodynamics applies as strictly to the human engine as to mechanical engines. Since the overwhelming share of calories consumed by the malnourished populations is required for BMR and essential maintenance…. the typical individual in the labour force had relatively small amounts of energy left for work.”
What does Malnutrition Cost the Nation • Malnutrition negatively impacts the GDP as it reduces physical/ cognitive growth, reduces productivity and earnings of individuals, and results in economic loss to the nation. • It lowers the resistance of the body to infections and capacity to recover from illness and adds to the health costs of the nation. • Protein Calorie Intake, Micronutrient Intake, Infections and illness, Nature of Occupation determine working capacity and income generation capacity • Based on the findings of NNMB repeat surveys in the years 1988-90 and 1996-97, that 30% of the households consume less than 70% of energy requirement, an attempt has been made to calculate loss of productivity in adults, and the resultant economic loss to the nation as a result of malnutrition. This equals approximately US $ 29 Billion (4% of GDP). • Other studies conducted by Administrative Staff College of India in the year 1996, CARE India and Linkages India 2003, confirm that 3% of GDP is lost on account of malnutrition and its various types of manifestations.
GDP Loss due to Calorie Deficit • Total no. of households in India= 193,579,954 (Census of India 2001) • 30% of households =58,073986 consume less than 70% of energy requirements(NNMB Repeat Surveys in 1988-90 and 1996-97) • Norm level of calorie intake: 2700Kcal Actual Calorie Intake: 1890 Kcal (70% of 2700Kcal) • Energy required for Basal Metabolic Rate (BMR): 1515 Kcal • Calorie left for productive work: 375 Kcal (1890 Kcal- 1515 Kcal) • Heavy work requires 219 Kcal per hour. • Moderate work requires 122 Kcal per hour. • Work hour lost per day per person due to inadequate calorie consumption:4 hours of moderate work and 7.5 hours of heavy work
GDP Loss due to Calorie Deficit Calculated on the formula: Ea X Total No. of days in year (365) Er X Total No. of working days in year (250) Ea: is the Energy available for work: 375 Kcal Er: is the energy required for a particular work: 219 Kcal for heavy work and 122 Kcal for moderate. Assuming average household has 5 Consumer Units,(NSS in Nutritional Intake in India, 50th Round, July 1993: June 1994) then total no. of population consuming less than norm level for calorie intake= 290,369,930 55% of Adults= 159,703,461. Based on actual average wage of Rs. 60/- per man per day of 8 hours, per hour earning = Rs. 7.50/- Loss of total money due to low productivity due to inadequate calorie consumption = Rs. 30/- approx. per day per person. Total money lost by entire adult population per day= Rs. 4,791,103,830.
GDP Loss due to Calorie Deficit Assuming total of 250 working days, total money lost in a year = Rs. 1,197,775,957,500 = US$ 29,944,398,937 approx. (1 US$= Rs. 40/-) = Approx. US $ 29 Billion Total GDP for year 2006-07 = Rs. 28481.57 billion, or US$ 712 billion GDP loss = 4% GDP In absence of reliable data this study does not take into account the productivity loss through protein and micronutrient deficit.
Estimated annual productivity losses due to Nutritional deficiencies 12 12
Other Studies • GDP Loss- US $ 114 billion between 2003 and 2012 owing to productivity losses due to PEM, IDD and IDA(CARE India and Linkages India,2003) • GDP Loss- US $ 2.3 billion or Rs. 103 billion, associated with foregone wage employment resulting from child malnutrition (Bhandari and Zaidi 2004) • GDP Loss-US $ 2.5 billion annually due to micronutrient deficiencies (Alderman 2005) • Productivity loss from stunting, iodine deficiency and iron deficiency resulting in loss of productivity 3% of GDP (Horton 1999)
International Comparisons • India’s position in the Human Development Report for 2008 is 134 from (128 of previous year), (China ranks 91, Sri Lanka 102 and Bangladesh 146). • Despite our high growth rate, the improvement in the nutritional status of our population has been marginal compared to countries like China, Sri Lanka, Bangladesh. • In certain indicators such as Children Under weight, and Stunted Children, the situation is worse than Sub Saharan countries such as Ethiopia, Angola, Sudan and Congo (DR) Cont…
Causes and Consequences of Malnutrition-The Cause Consequence Exchange • Since the problem of malnutrition is inter-generational, the solutionMust also be inter-generational. No single intervention can eradicate malnutrition. The package of interventions must be: • Inter-sectoral so as to address the majority of causes of malnutrition such as poverty, lack of access to health care, information, unsafe water and lack of sanitation, frequent infections • Cover the entire life cycle of women and children to create an immediate impact within one generation on the nutritional status of the three critical links of malnutrition, viz., infants & children, adolescent girls and pregnant and lactating women • Simultaneousso that the benefit of one intervention is not lost on account of absence of another
The Inter-generational Strategy: Pilot Project – Mokhada & Jawhar Blocks – Thane District - Maharashtra Unique Features • Interventions to address the critical inter-generational linkagesviz., Infancy and childhood, adolescence and motherhood • Providing information to the community regarding improving the nutritional status by generating awareness regarding the Inter-generational cycle of malnutrition and ill health through a strong Health and Nutrition Education module for the care of infants, adolescent girls, pregnant and lactating mothers • Training Women’s Self Help Groups for Production of low cost indigenously prepared energy food supplements appropriate to the needs of the three critical links • Consumption of Energy Food by the 3 groups (infant and child feeding under supervision) • Demand creation/other critical interventions, such as, providing timely immunization, de-worming, information on safe handling of drinking water, chlorination of drinking water at domestic level, Sanitation, information on prevention and control of diarroeah, preparation of ORS, providing IFA tablets, health check ups and referral services for women and children
Project Status The project is under implementation with the help of NGO MITTRA- BAIF since September 2006 in the tribal blocks of Jawhar and Mokhada, Thane District, Maharashtra with the following progress: • Baseline Survey • Awareness Generation, (ongoing) • Capacity Building of SHGs for the production and distribution of energy foods • Setting up of 8 Production Units of in each tribal block • Production of energy foods for all the three target groups • Consumption of energy foods by infants and children commenced in August 2007 and for adolescent girls and pregnant and lactating mothers in September 2007 • Monthly Weight Monitoring of all the three target groups The Monthly Weight Monitoring results reveal that there has been a steady weight gain for all the three target groups viz., infants and children, adolescent girls, pregnant and lactating women. The response of the community indicates that they have a better sense of well being on all accounts Cont…
Coverage of the Project- Aug.07- May 09 Jawhar Mokhada Total Total no. of Infants (0-6 mths) - 73 78 151 Total no. of Children (6 mths - 6 yrs) - 3579 2456 6035 Total no. of Adolescent Girls - 297 407 704 Total no. of Pregnant Women - 83-134 162-178 245-312 Total no. of Lactating Women - 238-251 147-226 385-477 Total Population 31,210 27,512 58,722 (50 villages in each block)-
Success of Strategy – Significant Reduction in LBW babies Jawhar Block Mokhada Block
Infant & Child Mortality Infant Mortality Child Mortality
Significant Improvement in Nutritional Status - Infants- 6-23 months - WHO norms Jawhar Mokhada
Significant Improvement in Nutritional Status – Children 2-6 years - WHO norms Jawhar Mokhada
Average Weight & Hb count - Adolescent Girls Jawhar Mokhada
Average Weight Gain & Hb count among Pregnant & Lactating Women Pregnant Women Lactating Women
Composition & Portion of Energy Food for Infants & Children Ragi (Millet) Malt Energy Food for Infants and Young Children (6 months-6 years): Ingredients: Germinated Ragi (70 gms), Germinated Wheat (15 gms), Green Gram (15 gms), Milk/ Water Sugar. Process: Germinated, Roasted, Milled, Sieved, Mixed. Portion Size: for Infants 6 months – 12 months - 50 gms Children + 12 months- 100gms. Nutritive Value of Ragi Malt - (100 gms). No. Ingredient Nutritive value 1. Protein(g) 10.48 2. Energy (kcal) 331.00 3. Calcium (mg) 250.00 4. Phosphorous (mg) 300.00 5. Iron(mg) 4.13 6. Beta carotene (mg) 53.10 7. Thiamine (mg) 0.433 8. Riboflavin (mg) 0.200 9. Niacin (mg) 1.91 10. Folic Acid (mg) 18.30
Composition & Portion of Energy Food for Adolescent Girls, Pregnant & Lactating women. Energy Food for Adolescents, Pregnant and Lactating Women: Ingredients: Germinated Ragi (75 gms), Defatted Soya(20 gms), Peanuts & Jaggery. Process: Germinated, Roasted, Milled, Sieved, Mixed. Portion Size for Adolescent Girls 100 gms, Pregnant and Lactating Women: 150 gms. No. Ingredient Nutritive value 1. Protein(g) 17.00 2. Energy (kcal) 330.00 3. Calcium (mg) 410.50 4. Phosphorous (mg) 235.40 5. Iron(mg) 6.00 6. Beta carotene (mg) 1161.00 7. Thiamine (mg) 0.472 8. Riboflavin (mg) 0.511 9. Niacin (mg) 1.783 10. Folic Acid (mg) 46.700
Improvement in Nutritional Status of Women and Children Name: Piyanka Vilas Gavali Age: 10 months Before After 5 months 31
Improvement in Nutritional Status of Women and Children Name: Shakuntala Eknath Sanekare After Delivery During Pregnancy 32
Improvement in Nutritional Status of Child Name: Eshram Budhya Bhoye Before After 33
Improvement in Nutritional Status of Child After delivery (Gulab Vasant Bhondva - Dongarpada, Jawhar with Healthy Child) Lactating Women with healthy Savita Motiram Bonge- Dongarpada Kalpana Ravindra Bhoye- Dongarpada with Healthy Baby 34
Packaging NAGALI SAKAS AHAR VRINDAVAN MIX 36
Analysis of the current situation: • India has no comprehensive National Program for the eradication of Malnutrition. The ICDS programme in governmental and general perception is seen as a programme to address malnutrition. However, ICDS is not a programme for the eradication of malnutrition, but for Integrated Child Development. • Other Nutrition and related programmes such as the Mid Day Meal Programme, KishoriShaktiYojana, Vitamin A supplementation programme, National Nutritional Anaemia Control Programme, and the National Iodine Deficiency Disorder Control Progreamme address some of the causes of Malnutrition but not all of them. (iii) Malnutrition in India is deeply rooted in the inter-generational cycle. However, the current policies and programmes do not address the issue inter-generationally, as depicted in the diagram.
(iv) The population of India suffers from a high Protein Calorie deficit. Studies reveal that 30% of the households in India consume less than 70% of the energy requirement and calorie intake(NNMB repeat surveys 1988-1990 and 1996-97). (v) There is inadequate awareness and information regarding proper nutritional practices amongst the population. (vi) Crucial prescriptions of the National Nutrition Policy, 1993, were not translated into National Programmes, viz., popularization of low cost nutritious foods, reaching the adolescent girl, fortification of essential foods and control of micronutrient deficiencies. (vii) Most importantly, eradication of malnutrition should be articulated as high priority in the National Development Agenda.
A National Strategy to Combat Malnutrition Underlying Principles: Bridging the Calorie-Protein Gap • Introduce nutrition and micro-nutrient interventions for the three critical links of malnutrition viz. children 6 months – 6 years, adolescent girls, and pregnant and lactating women to be prepared by SHGs from low cost, locally available agricultural produce. • Introduce nutrition and micro-nutrient interventions for the general population to bridge the protein-calorie gap by making available in the market, protein-energy dense foods. • Make available low cost energy foods for the general population (Corporate Sector/PPP) • Structure and monitor tightly integrated multi-sectoral interventions to address all or majority of the direct and indirect causes of malnutrition simultaneously. • Initiate a sustained general public awareness campaign regarding proper nutritional practices within existing family budgets, and to create demand. • .
Essential Interventions to Combat Malnutrition • Direct interventions – Related to the consumption and absorption of adequate protein calorie/micro-nutrient rich foods essential to combat malnutrition, namely: • Weighment of child within 6 hours of birth and thereafter at monthly intervals. • Timely initiation of breastfeeding within one hour of birth, and feeding of colostrum to the infant. • Exclusive breastfeeding during the first six months of life. • Timely introduction of complementary foods at six months and adequate intake of the same, in terms of quantity, quality and frequency for children between 6-24 months. • Dietary supplements of all children between 6 months – 72 months through energy dense foods made by SHGs from locally available food material to bridge the protein calorie gap. • Safe handling of complementary foods and hygienic complementary feeding practices. • Complete immunization and Vit. A supplementation. • De-worming of all family members bi-annually.
Frequent, appropriate, and active feeding for children during and after illness, including oral rehydration with Zinc supplementation during diarrhea. • Timely and quality therapeutic feeding and care for all children with severe and acute malnutrition. • Dietary supplements of iron – rich, energy dense foods made from locally available food material prepared by women SHGs for adolescent girls and women, especially during growth periods and pregnancy to fill the protein calorie gap and ensure optimal weight gain during pregnancy. • Anaemia screening for children, adolescent girls and women. • Weight monitoring of all adolescent girls and pregnant women. • Prevention and management of Micro-Nutrient deficiencies, especially through IFA supplementation to prevent anaemia in adolescent girls and women. • Making available low cost energy foods for the general population. • Fortification of common foods.
Indirect Interventions – Related to issues of health, safe drinking water, hygienic sanitation and socio-cultural factors such as early marriage and pregnancy of girls, female literacy and poverty reduction, to eradicate malnutrition on a long term, sustainable basis. • Access to safe drinking water (treatment, storage, handling and transport), sanitation and hygiene. • Increased female education and completion of secondary schooling for the girl child. • Increased access to basic health services by women. • Expanded and improved nutrition education and involvement at Panchayat and community level to create demand. • Increased gender equity. • Promotion of nutrition best practices especially for girls and women.
Nutrition Monitoring and Surveillance • A computerized Central and Block level monitoring systems should be devised with deliverable targets and time frames • An effective concurrent monitoring system through an external agency can also be established for measuring outcomes, and for effecting changes and mid course corrections • At the AW level, community based nutrition monitoring and surveillance through ICDS infrastructure could include growth monitoring of infants and children and weight monitoring of adolescent girls and women • Creating a data base on the nutritional status of children, adolescents and women in each Anganwadi
Concluding Observations: • Since at least 4% of India’s GDP ($29 Billion) annually is lost on account of malnutrition, the cost of addressing malnutrition is far below the cost of not addressing it. • It may be noted that the cost of construction of 3 kilometres of rural road is in excess of the amount required to address the nutrition deficit of the key target groups in the Block. • Investing in human resources development for the future – in the shape of healthy children, adolescents and adults with higher cognitive and productive capacity, is an investment that will pay for itself several times over, will eradicate the curse of malnutrition in the shortest possible time, so that every Indian is able to reach his or her full physical and cognitive potential, enhance income generation capacity and contribute to the country's progress.