Download
1 / 1
10 likes | 83 Views
A. B. C. Figure S4: Evolution of E. coli and E. faecalis in monoxenic and dixenic groups . Bacterial groups were quantified by RT- qPCR with the species-specific 16S rRNA gene-targeted primers described by ( Furet et al. , 2009).

E N D
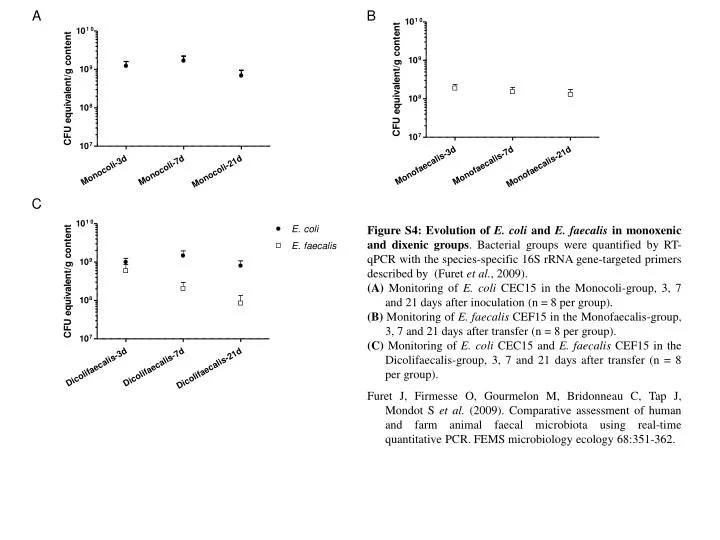
A B C Figure S4: Evolution of E. coli and E. faecalis in monoxenic and dixenic groups. Bacterial groups were quantified by RT-qPCR with the species-specific 16S rRNA gene-targeted primers described by (Furet et al., 2009). (A) Monitoring of E. coli CEC15 in the Monocoli-group, 3, 7 and 21 days after inoculation (n = 8 per group). (B) Monitoring of E. faecalis CEF15 in the Monofaecalis-group, 3, 7 and 21 days after transfer (n = 8 per group). (C) Monitoring of E. coli CEC15 and E. faecalis CEF15 in the Dicolifaecalis-group, 3, 7 and 21 days after transfer (n = 8 per group). Furet J, Firmesse O, Gourmelon M, Bridonneau C, Tap J, Mondot S et al. (2009). Comparative assessment of human and farm animal faecal microbiota using real-time quantitative PCR. FEMS microbiology ecology 68:351-362.
