1 / 1

* Estimate is statistically different from estimate for the previous year shown (p<.05 ).

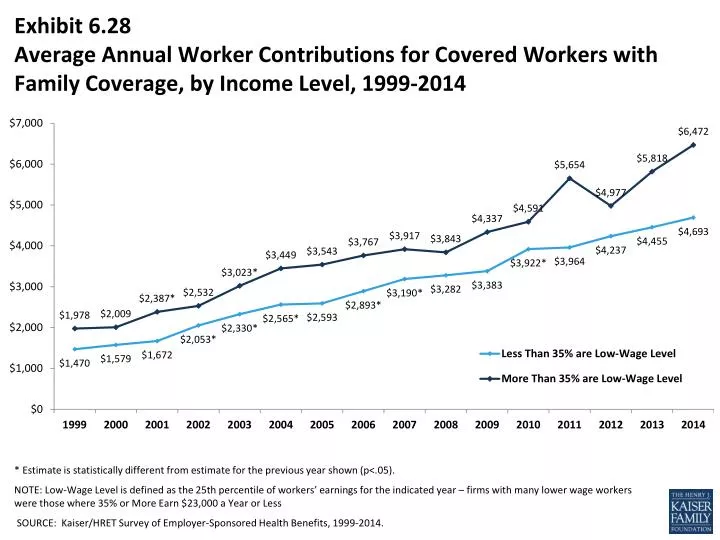
Exhibit 6.28 Average Annual Worker Contributions for Covered Workers with Family Coverage, by Income Level, 1999-2014. * Estimate is statistically different from estimate for the previous year shown (p<.05 ).

Download Presentation

* Estimate is statistically different from estimate for the previous year shown (p<.05 ).

An Image/Link below is provided (as is) to download presentation Download Policy: Content on the Website is provided to you AS IS for your information and personal use and may not be sold / licensed / shared on other websites without getting consent from its author. Content is provided to you AS IS for your information and personal use only. Download presentation by click this link. While downloading, if for some reason you are not able to download a presentation, the publisher may have deleted the file from their server. During download, if you can't get a presentation, the file might be deleted by the publisher.

E N D

Presentation Transcript


  1. Exhibit 6.28Average Annual Worker Contributions for Covered Workers with Family Coverage, by Income Level, 1999-2014 * Estimate is statistically different from estimate for the previous year shown (p<.05). NOTE: Low-Wage Level is defined as the 25th percentile of workers’ earnings for the indicated year – firms with many lower wage workers were those where 35% or More Earn $23,000 a Year or Less SOURCE: Kaiser/HRET Survey of Employer-Sponsored Health Benefits, 1999-2014.

More Related