Download
1 / 95
980 likes | 1.12k Views
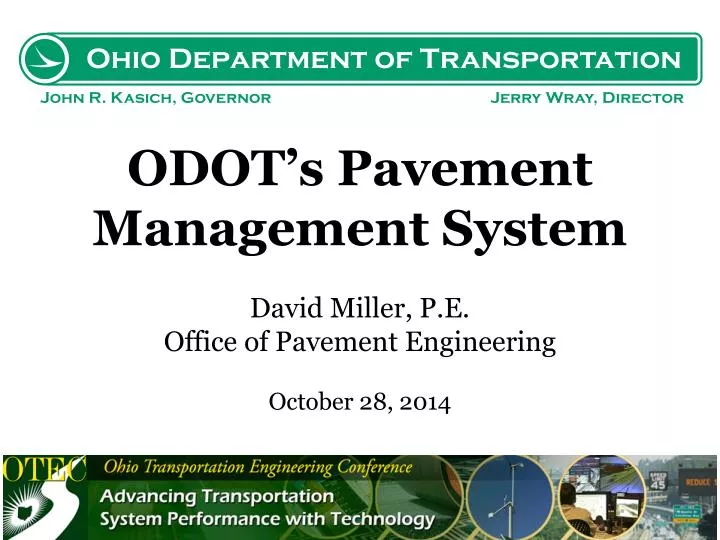
October 28, 2014. ODOT’s Pavement Management System David Miller, P.E. Office of Pavement Engineering October 28, 2014. ODOT by the Numbers. 49,397 Lane-miles 10,367 Traffic sections 227 Pavement projects in 2013 21,465 Projects in history database. ODOT by the Numbers.

E N D
October 28, 2014 ODOT’s Pavement Management SystemDavid Miller, P.E.Office of Pavement EngineeringOctober 28, 2014
ODOT by the Numbers 49,397 Lane-miles 10,367 Traffic sections 227 Pavement projects in 2013 21,465 Projects in history database ODOT's Pavement Management System
ODOT by the Numbers 12,913 PCR sections in 2013 29 Years of PCR data 251,339 Historical PCR sections ODOT's Pavement Management System
ODOT Data Strengths and Weaknesses • Weaknesses • Lack of analysis tools • Reduced staff • Staff turnover • Strengths • Data rich • Consistent PCR • Detailed distress data ODOT's Pavement Management System
Pavement Management System dTIMS Deighton Total Infrastructure Management System ODOT's Pavement Management System
Pavement Condition Rating • PCR = Pavement Condition Rating • Zero to 100 scale • 100 is best • Visual inspection of distresses • Deduct values determined based on severity and extent of distresses ODOT's Pavement Management System
1.5 5.6 4.0 11.1 5.6 89 ODOT's Pavement Management System
Programmed Projects ODOT's Pavement Management System
Decision Trees ODOT's Pavement Management System
Pavement Treatment Activities 20 – Crack Sealing 25 – Chip Seal 30 – Microsurfacing 38 – Fine Graded Polymer AC 40 – CPR 50 – AC Overlay w/o Repairs 60 – AC Overlay with Repairs ODOT's Pavement Management System
Pavement Treatment Activities 70 – Crack and Seat 77 – Rubblize and Roll 90 – Unbonded Concrete Overlay 100 – New Flexible Pavement 110 – New Rigid Pavement ODOT's Pavement Management System
Project Unit Costs Project scopes for every bin-activity combination Pavement item quantities for sample projects Unit prices by county Project square yard costs ODOT's Pavement Management System
By the Numbers 88 counties 83 bin-activity combinations 88 x 83 = 7304 project SY unit costs 5 pay items per project (average) 7304 x 5 = 36,520 unit prices ODOT's Pavement Management System
Project Unit Costs ODOT's Pavement Management System
Project Unit Costs ODOT's Pavement Management System
Transition Probability Matrix ODOT's Pavement Management System
Predicted Deduct Values ODOT's Pavement Management System
By the Numbers 3 Systems (P, G, U) 12 Districts + Statewide 3 Pavement types 17 PCR distresses 12 Pavement treatment activities 3 x 13 x 3 x 17 x 12 = 23,868 matrices ODOT's Pavement Management System
Predicted Deduct Values ODOT's Pavement Management System
Distress Code Lookup ODOT's Pavement Management System
Treatment Resets ODOT's Pavement Management System
Project History Database • Projects entered by Tech Services • Linked to Sitemanager/CMS • Quantities and costs • Stores project location, activity, materials, thicknesses, etc. ODOT's Pavement Management System
Traffic • AADT • Truck ADT • Traffic growth factor • Positive or negative ODOT's Pavement Management System
Budget ≠ Allocation ODOT's Pavement Management System
By the Numbers • 4 Budgets per district • Entire network, Priority, General, Urban • 4 Statewide budgets • Network, Priority, Urban, General • 3 Funding levels per system • Zero, actual (base), unlimited • 4 x 3 x 13 = 156 budgets ODOT's Pavement Management System
When the System Runs Determine analysis sections Determine last pavement treatment activity Determine PCR rating to use and all distresses Determine transition probability matrices to use ODOT's Pavement Management System
When the System Runs Deteriorate all sections 1 year Determine possible treatments from decision trees Calculate treatment costs Reset all PCR deducts Deteriorate all possible treatments and do nothing 1 more year and repeat ODOT's Pavement Management System