Download
1 / 22
220 likes | 281 Views
Precinct 3 TWA Economic Analysis. Prepared for Town of Port Hedland Mark Wallace Senior Economist and Team Leader- Perth AEC Group Ltd. Overview. Introduction. AEC group was engaged by the Town of Port Hedland (ToPH) to provide high level economic analysis of the proposed deal with BHP.

E N D
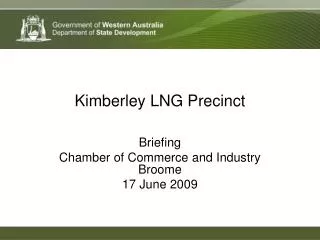
Precinct 3 TWA Economic Analysis Prepared for Town of Port Hedland Mark Wallace Senior Economist and Team Leader- Perth AECGroup Ltd
Introduction • AECgroup was engaged by the Town of Port Hedland (ToPH) to provide high level economic analysis of the proposed deal with BHP. • This deal would entail: • Development of a 6,000 bed TWA in Precinct 3 (Airport) of ToPH on 60ha for a 10 year lease • In return , BHP will invest in the subdivision service costs necessary for ToPH to release 40-50ha of bulky goods/industrial land onto the market and 10ha for BHP for other uses. • This report entails: • Economic Impact Analysis of project/development expenditure • Opportunity cost analysis of non-development and • Commentary on the impact on service and facility providers.
Economic Impact AssessmentMethodology • The economic impact assessment uses an Input-Output model to examine impacts of the proposed development in: • Port Hedland Local Government Area (LGA) and • Western Australia. • Input-Output models have been developed for Port Hedland and Western Australia using: • The Australian Input-Output Transaction Tables for 2006-07 as a parent table (ABS, 2010a) and • A process of regionalising the parent table based on cross-industry location quotients and demand-supply pooling (as described in West, 1993).
Economic Impact AssessmentOutputs • Used to demonstrate how an increase in final demand for one industry affects a change in demand for, or production in, other industries. • Economic impacts can be traced via: • Direct impacts: from direct expenditure on goods and services and • Flow-on impacts: subsequent round effects of increased purchases by suppliers in response to increased sales. • Effects examined across four types of impacts: • Output: gross value of goods and services transacted. Can lead to double counting of some goods and services • Value added: value of output after deducting costs of goods and services used in the production process. Value added is the preferred measure for assessing economic impacts • Income: wages and salaries paid to employees and • Employment: employment positions generated by an economic shock, expressed in terms of full time equivalent (FTE) positions.
Economic Impact AssessmentAssumptions • Modelling assumes: • Constant returns to scale and no substitution between inputs • Production within an industry is homogenous across firms in that industry (i.e., same proportion of inputs are used by every firm in a given industry) • Each industry has only one primary output • The effect of carrying out a given level of production by one firm or many is the same • The economy examined is in equilibrium at given prices and • There are no capacity constraints so that the supply of each good is perfectly elastic. Each industry can supply whatever quantity is demanded of it and there are no capital restrictions.
Economic Impact AssessmentModel Drivers • Capital Expenditure: $941 million • Sub-Division: $41 million • Stage 1 TWA (2012-13 to 2013-14): $300 million • 2,000 beds at $150,000 per bed • Stage 2 TWA (2014-15): $300 million • 2,000 beds at $150,000 per bed • Stage 3 TWA (2015-16 to 2016-17): $300 million • 2,000 beds at $150,000 per bed • Comprised of: • Construction services: to undertake sub-division • 100% undertaken within Port Hedland • Professional fees (e.g., design): assumed 12% of Stages 1, 2 and 3 • 0% undertaken in Port Hedland • 75% undertaken in Western Australia • Residential construction: assumed 88% of Stages 1, 2 and 3 • 100% undertaken within Port Hedland
Economic Impact AssessmentModel Drivers • For modelling purposes, TWA assumed to operate in a similar fashion to the accommodation industry in terms of goods and services required • Direct impacts: • Assumed employment of 75 FTE staff for management, administration and catering purposes • Assumed average annual salary of staff of $100,000 per FTE • To estimate indirect impacts, have assumed: • Equivalent revenue of TWA (if operating as an accommodation establishment) of approximately $200 per bed per day • For 6,000 beds (assuming 100% occupancy), equivalent output of $438 million per annum • $438 million has been used in the Input-Output model to estimate indirect impacts (i.e., flow-on demand for support goods and services, such as building cleaning and maintenance services)
Economic Impact AssessmentResults – Construction Activity • In total (over the entire construction phase), construction activity will directly and indirectly support in Port Hedland LGA approximately: • $1.3 billion in output • $390 million in value added activity • $250 million in wages and salaries and • 2,350 FTE jobs. • In total, construction activity will support in Western Australia (including direct and indirect impacts), approximately: • $1.9 billion in output • $680 million in value added activity • $420 million in wages and salaries and • 3,900 FTE jobs. Construction Impacts on Port Hedland LGA Source: AECgroup Construction Impacts on WA Source: AECgroup
Economic Impact AssessmentResults – Construction Activity • Construction activity will primarily benefit the industries of: • Construction • Professional, scientific and technical services and • Manufacturing. Impacts on Employment and Gross Value Added by Construction Activity,by Industry, Port Hedland (T) and WA Source: AECgroup
Economic Impact AssessmentResults – Operational Activity • Once all 6,000 beds are operational, the project will support on an annual basis in Port Hedland LGA (including direct and indirect impacts), approximately: • $380 million in output • $55 million in value added activity • $40 million in wages and salaries and • 526 FTE jobs. • Once all 6,000 beds are operational, the project will support on an annual basis in Western Australia (including direct and indirect impacts), approximately: • $535 million in output • $125 million in value added activity • $75 million in wages and salaries and • 1,000 FTE jobs. Operational Impacts on Port Hedland LGA Source: AECgroup Operational Impacts on WA Source: AECgroup
Economic Impact AssessmentResults – Operational Activity • A wide range of industries will benefit from operational activity, in particular: • Administrative and support services (e.g., cleaning services) and • Manufacturing. Impacts on Employment and Gross Value Added by Operational Activity,by Industry, Port Hedland (T) and WA Source: AECgroup
Opportunity CostMethodology and Assumptions • AECgroup has analysed the opportunity cost to the Town of Port Hedland and the WA economies of the development not occurring. • Opportunity cost in this circumstances is measured by the capital expenditure proposed to take place that would otherwise not occur in the absence of the TWA • Calculated by allocating the capital expenditure (CapEx) to construction worker ratio for Pilbara Iron Ore projects (from ABARES data) to the assumed TWA capacity over time. • Assumptions include: • CapEx to worker ratio of $1.81m per project • Average project length of two years • That the TWA is at capacity during its lifetime • That the full 10 year lease is exercised. Opportunity CostMethodology • Source: AECgroup
Opportunity CostResults • Total capital expenditure that will be supported by construction workers to be accommodated at the Precinct 3 TWA is $46.99b over the 10 years • Represents strong capacity to support both short-term and long-term project investment and development by BHP • $25.76b in Net Present Value terms at 8% discount rate. • Precinct 3 TWA Opportunity Cost Results, Nominal and NPV • Source: AECgroup
Opportunity CostResults • Level of capital expenditure supported by workers accommodated by the Precinct 3 TWA will increase with growth in TWA capacity over time. • To exceed $5b of supportable capital expenditure per year from 2017/18 onwards. Capital Expenditure Supported by Accommodated Construction Workers (Nominal), 2012/13 to 2023/24 Source: AECgroup
Impact on Services and FacilitiesExisting TWAs • Up to 1,000 beds of the new TWA may be utilised to consolidate BHP’s workforce from existing TWAs and other accommodation • AECgroup has estimated net additional demand for TWA accommodation over next 5 years (extent of known forward iron ore mining and infrastructure project pipeline) • Assumptions include: • Existing supply is currently fully occupied • 100% of existing supply will become vacant every 5 years due to project completions • 90% of project employment is FIFO • 80% of FIFO workers require TWAs • 75% of TWA capacity is required in ToPH • Includes both construction and operational workforces.
Impact on Services and FacilitiesExisting TWAs • In 2016, there will be a requirement for an additional 3,378 TWA beds in ToPH above current and proposed supply (including Precinct 3 TWA and potential Hospital site development in West End) • This is almost equivalent to the total capacity of current TWA supply (3,565 beds) in ToPH; • This requirement does not take into consideration demand from property and general infrastructure sectors • Existing TWA operators will continue to experience strong demand. TWA Supply Gap, Town of Port Hedland, 2016 Source: AECgroup
Impact on Services and FacilitiesLight Industry/Bulky Goods • General/Light and Transport-based industrial land supply pipeline is steadily reducing (only 190ha available in 2010) • According to the City Growth Plan, there is currently only 6 years of theoretical supply left, though market already experiencing shortages due to lack of choice and site fragmentation • There is projected to be a Net Deficit in supply by 2017/18 rising to need for 240ha of additional zoned and serviced industrial land by 2031 • Suggests Airport land would be well timed in providing market choice and meeting demand in short-to-medium term. General Industry and Transport and Logistics Land Supply Gap, Town of Port Hedland, 2011 to 2031 Source: AECgroup
Impact on Services and FacilitiesLight Industry/Bulky Goods • Current bulky goods supply limited, with business-to-business wholesalers (Blackwoods and Auslec) accounting for majority • Strong growth in population targeted under Pilbara Cities will support Bulky Goods floorspace demand in short- and long-term • Will support establishment of more diversified retail offering to benefit of local residents and the attractiveness of Port Hedland in attracting workers • Impact on existing providers likely limited to extent of business that targets general population.
Conclusions • Significant construction and operational impacts of Precinct 3 TWA on both Port Hedland (T) and WA economies • Opportunity cost of non-development is the loss to Port Hedland and WA economies of significant capital expenditure investment ($46.99b in nominal terms of iron ore mining and infrastructure projects) • There will continue to be a need for additional TWA capacity, above and beyond current supply and the delivery of Precinct 3 TWA. This will provide support to existing TWA operators in the event of any consolidation of workers by BHP into the Precinct 3 facility. • Light industry land supply is increasingly constrained and fragmented and lacks diversity and choice. Theoretical supply will be fully exhausted by 2016/17 but additional supply will be required within next two years • Current bulky goods supply is limited and demand is projected to grow strongly on back of Pilbara Cities population target. B2B suppliers will experience only minor impacts.
References • ABARES (2011). Mineral and Energy – Major Developments, April 2011, Australian Bureau of Agricultural and Resources Economics and Sciences, Canberra. • ABS (2010a). Australian National Accounts: Input-Output Tables – Electronic Publication, Final release 2006-07 tables. Cat. No. 5209.0.55.001, Australian Bureau of Statistics, Canberra. • ABS (2010b). Number of Employed Persons by Industry of Employment (ANZSIC 93 all 4 digit classification levels) by all Place of Work LGAs in Australia. Data provided by Information Consultancy Services, Australian Bureau of Statistics, Brisbane. • BHP Billiton (unpublished). Private Treaty Between BHP Billiton and Town of Port Hedland – Development Proposal for Airport Land, 19 July 2011. Confidential information provided by BHP Billiton. • Town of Port Hedland (2011). DRAFT City Growth Plan, Town of Port Hedland, Western Australia. • Town of Port Hedland (unpublished). Cost estimates for the TWA. Unpublished data provided via email, 20thSeptember 2011. • West, G. R. (1993). User’s Guide, Input-Output Analysis for Practitioners An Interactive Input-Output Software Package Version 7.1. Department of Economics. University of Queensland. • WAPC (2011). Port Hedland Regional Hot Spots Land Supply Update, Western Australian Planning Commission, Perth.
Contact AECgroup Mark Wallace Senior Economist and Team Leader L18 Central Park, 152-158 St Georges Terrace, Perth T: +61 8 9288 4456F: +61 8 9288 4457M: 0431 676 254E: mark@aecgroupltd.comW: http://www.aecgroupltd.com