Download

1 / 21
210 likes | 354 Views
Linearity and Ordinary Least Squares Fitting. ABE425 Engineering Measurement Systems. First, we need to talk about linearity. In Mathematics, there are linear and non-linear operations : If an operation is linear, the superposition principle can be applied:. Examples.

E N D
Linearity and Ordinary Least Squares Fitting ABE425 Engineering Measurement Systems
First, we need to talk about linearity • In Mathematics, there are linear and non-linear operations: • If an operation is linear, the superposition principle can be applied:
Examples • Multiplication by a constant c (linear)
Examples • Differentiation (linear)
Examples • Integration (linear)
Examples • Squaring (non-linear)
Examples • Square root (non-linear)
You collected a set of data pairs (for example temperature versus time • >> x=[0:1:10]' • >> y = [0.5 0.75 1.25 1.3 2.1 2.0 3.1 3.05 4.0 4.5 5]'
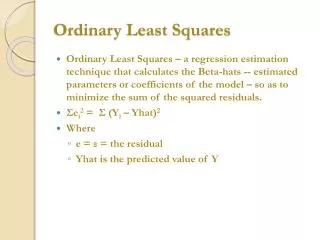
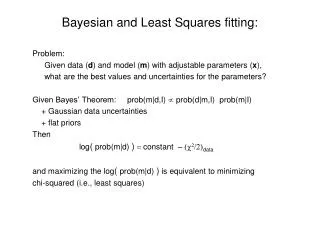
Model is some function of the independent variable and the parameter vector • The error is the difference between a data point and the corresponding model
The idea of using the sum of least squared residuals came from Legendre: • How can we minimize this error with respect to the parameter vector? In other words, how can we find the parameter vector that minimizes the error and maximizes the fit? “Sur la Méthode des moindres quarrés” in Legendre’s Nouvelles méthodes pour la détermination des orbites des comètes, Paris 1805.
The minimum value of the sum of squares is obtained by setting this partial derivative to zero • The derivative is partial, because the Sum of residuals S is a function of the error and the error itself is a function of the parameter vector (remember the chain rule):
The minimum value of the sum of squares is obtained by setting this partial derivative to zero • Substitution of the results from the previous slide gives: • Now, we need to find out what is
The proposed model is linear in the parameters. Here is an polynomial example: • For each ith measurement this can be written using a matrix and a parameter vector as follows: • This can also be written as:
For all measurement points we obtain: • This can also be written in vector form as:
From the model definition we can obtain the partial derivative with respect to the parameter vector
Upon rearrangement these become n simultaneous linear equations, the normalequations.
Determine whether the data needs an intercept. Often physical constraints demand that the fit curve passes through the origin! No intercept!
OLS lab function [theta, msq] = fitols(x,y,Ovec) % Fit polynomial function on data in OLS sense % Author : % Date : % Revision : % % Syntax : [theta,msq] = fitols(x,y,Ovec) % % theta : Parameter vector % msq : Mean square error % x : Independent variable % y : Dependent variable % % Ovec indicates terms [1 x x^2 ..]*Ovec' % Example Ovec = [1 0 1] gives [1 x^2] and not x % If vectors x,y are horizontal, transpose them to make them vertical % Make sure the x and y vector have the same length. If not alert the user % with an error dialog box (type help errordlg ) % Build the matrix of regressors. Check each entry of Ovec, and if it is a % 1, add another column to the regression matrix A. A = []; % Compute the parameter vector theta using the OLS formula % Compute the error vector % Compute the mean square error which indicates how good the fit is % Plot y (Temperature in C) versus x (Current in A). Add labels and title. % Your output should look as shown in the handout.