Download
1 / 46
460 likes | 626 Views
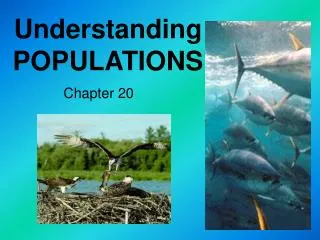
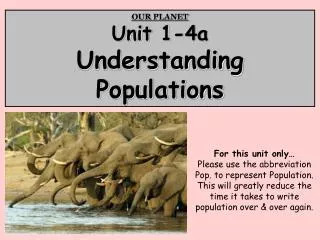
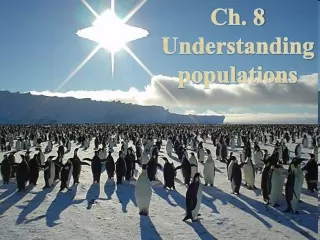
Understanding Populations. The Human Population. From 1900 to 2003, the population tripled in size to reach 6.3 billion people Today, the human population count is over 7 billion and we are projected to reach 9 billion within the next 50 years

E N D
The Human Population • From 1900 to 2003, the population tripled in size to reach 6.3 billion people • Today, the human population count is over 7 billion and we are projected to reach 9 billion within the next 50 years • While our population has increased, others have dramatically decreased
Population of… China: 1.3 billion India: 1.2 billion Significant advances in medicine through science and technology Industrial Revolution Human population growth adding 75 million/year What factors have contributed to this exponential growth pattern? 20137 billion Bubonic plague "Black Death" 1650500 million
Properties of Populations For example, all of the bass in a pond are considered a population, because they are isolated in the pond and don’t interact with bass living in other ponds • Populations are a group of organisms that belong to the same species and live in a particular place at the same time • They can be widely distributed , or confined to a small area
Properties of Populations • Boundaries can be imposed by environmental features, or they can be arbitrarily chosen to simplify a study of the population • Population studies focus on a population as a whole – how many individuals are born, how many die, and so on
Properties of Populations • Three main characteristics of populations: • 1) Population Size • 2) Population Density • 3) Dispersion
Population Size How many blades of grass are in this football field? • The number of individuals that the population contains • Size is a fundamental population property and can be difficult to measure directly, so sometimes we must estimate
Population Size • How many oak trees are in this forest that is 10 km2? • Extrapolate • Count how many are in 1 km2 and multiply by 10.
Measuring population size • How do we measure how many individuals in a population? • number of individuals in an area • mark & recapture methods Difficult to count a moving target sampling populations
Population Density • A measure of how crowded a population is • Expressed as the number of individuals per unit of area or volume
Dispersion • From Latin dis- meaning out and spargere- meaning to scatter • The spatial distribution of individuals within the population
Types of Dispersion • Clumped – individuals clustered together • Uniform – separated by a fairly consistent distance • Random – each individual’s location is independent of the locations of other’s
Clumped Distributions • Occur when resources such as food or living space are limited • Occur because of species social behavior (flocks)
Uniform Distributions • Result when individuals within the same habitat stay as far away from each other as possible • When a bird locates its nest so it’s not close to other birds nests.
Random Dispersion • Few populations are truly randomly dispersed • Usually they show degrees of clumping or uniformity • Also depends on the scale at which the population is being observed
Population Dynamics • All populations are dynamic – they change over time • Look at birth rate, death rate, and life expectancy
Population Dynamics • Birth Rate: the number of births occurring in a period of time • Death/Mortality Rate: the number of deaths in a period of time • Life Expectancy: How long an individual is expected to live
Age Structure • The distribution of individuals among different ages in a population • Often presented as graphs • Many important population processes vary with age
Age structure • Relative number of individuals of each age What do the data imply about population growth in these countries? A C B
Patterns of Mortality • Mortality data tends to match one of three curves on a graph • Known as survivorship curves • These show the probability that members of a population will survive to a certain age
Patterns of Mortality • Type I – Death late in life (humans) • Type II – Probability of dying doesn’t change (birds) • Type III – More likely to die young (salmon)
TRUE OR FALSE: A population consists of individuals of the same species living together in one place at the same time. TRUE
TRUE OR FALSE: Dispersion is the term for how populations are distributed within a ecosystem. False – it refers to the distribution of the individuals of a particular population within a particular area
TRUE OR FALSE: The birth rate in a population equals the death rate. False – both can fluctuate
Measuring Populations A single pair of elephants can increase to a population of 19 million individuals within 750 years! Why haven’t they increased their numbers?
Population Growth Rate • The amount by which a population’s size changes in a given time • Whether a population grows, shrinks, or remains the same size depends on: • Birth • Death • Immigration • Emigration
Population Growth Rate • Immigration – movement of individuals into a population • Emigration – movement of individuals out of the population • Immigration & birth add to a population • Emigration & death subtract from a population • Assume immigration = emigration
Population Size • Demographers divide large populations into groups of 1,000 and to present data per capita, meaning per individual • Birth rates, death rates, and growth rates for large populations are usually expressed per capita
Population Size • Example: • If there are 52 births and 14 deaths per 1000 individuals per year: • Birth Rate = 52/1000 = 0.052 births per capita per yr • Death Rate = 14/1000 = 0.014 deaths per capita per yr • Growth rate can be calculated by: • Birth rate – Death Rate = Growth Rate
Population Size • Calculating per capita growth: 0.052 births per capita – 0.014 deaths per capita = 0.038 growth per capita • A positive growth rate means population is growing; negative means it’s shrinking
Population Size • To find the number of new individuals that will be added to the population in a year, just multiply the per capita growth rate by the number of individuals in the population Ex] Population = 50,000 Growth = 0.038 per capita 0.038 x 50,000 = 1900
The Exponential Model • At a steady positive growth rate, the population will add a larger number of individuals with each generation • A pattern of increase in number due to a steady growth rate is exponential growth
The Exponential Model • A graph of the population size over time for exponential growth makes a J-shaped curve • Population size grows slow when small, but increases as individuals join the population
The Exponential Model • Leads us to predict that population size will increase indefinitely and by a greater number with each time period • Do you think this trend will continue? What will the graph look like in the future?
Applying the Exponential Model • This model matches observed patterns of growth of real populations, but only under a certain number of conditions and for a limited period of time • Example] Bacteria can grow exponentially if provided with an abundance of food and space and if waste is removed
Applying the Exponential Model • This doesn’t apply to most populations because resources aren’t unlimited and harmful waste accumulates • Any factor, such as space, that restrains the growth of a population is called a limiting factor • All populations are limited by their environment
Applying the Exponential Model • As a population grows, competition intensifies for resources • Thus, each individual’s ability to fight off disease, grow, and reproduce decreases • This results in a decreasing birth rate and increasing death rate
The Logistic Model • Builds on the exponential model but accounts for the influence of limiting factors • Carrying capacity (K) is the number of individuals the environment can support over a long period of time
The Logistic Model • The graph of this model looks like a stretched-out letter S • When population is small, birth rates are high and death rates are low, so looks like exponential growth • As size approaches K, the growth rate slows • At K, the birth rate = death rate and growth stops
The Logistic Model • Contains some assumptions • K is constant and doesn’t fluctuate with environmental changes • Reality is, it does. Ex] It is greater when prey is abundant and lower when it is scarce.
The logistic and exponential models are not universal representations of real populations – but – they are an important tool that scientists use to explain population growth and regulation.
True or False: Carrying capacity is the number of individuals the environment can support for an extended period of time. True!!!
True or False: Population growth can be predicted using only birth- and death-rate statistics. False – Immigration and emigration rates are important factors to consider!!!
How many new individuals will there be next year in a population of 85,000 people if there are 98 births and 75 deaths per thousand people? 0.098 births per capita – 0.075 deaths per capita = 0.023 growth per capita 0.023 x 85,000 = 1955 new individuals