Download
1 / 51
510 likes | 607 Views
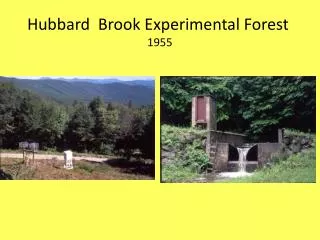
Acid Rain Revisited Hubbard Brook Research Foundation. Science Links Bridging the Gap between Science and Policy. Outline. Patterns of Emissions and Deposition Forest Ecosystem Effects Ecosystem Response to Management Strategies Conclusions. Patterns of Emissions and Deposition.

E N D
Acid Rain RevisitedHubbard Brook Research Foundation Science Links Bridging the Gap betweenScience and Policy
Outline • Patterns of Emissions and Deposition • Forest Ecosystem Effects • Ecosystem Response to Management Strategies • Conclusions
allowances allocated for that year Phase I sources all sources Phase II sources SO2 Emission Reductions under the Acid Rain Program
SO2 Emissions and the Allowance Bank, 1995- 2003 Allowances allocated that year Unused allowances from previous year (bank) Actual emissions from affected sources 21.6 19.9 16.6 18.8 18.1 15.0 11.7 13.5 8.7 SO2 Emissions (million tons)
1990 emissions Phase I (1995-1999) average emissions Phase II (2000-2003) average emissions SO2 Emission Reductions, by State scale: 1990 emissions in Ohio were 2.2 million tons
8.1 projected emissions level in the absence of Title IV
1990 emissions Phase I (1996-1999) average emissions Phase II (2000-2003) average emissions NOx Emission Reductions, by State scale: 1990 emissions in Ohio were 500,000 tons
Source Area Includes: VT, MA, NY, NH, CT, RI, ME, OH, PA, DC, MD, NJ, DE, MI, VA, WV, QUE, ONT
Soil Acid Rain Effects • Soil S and N enrichment • Nutrient cation (Ca2+, Mg2+) depletion • Al mobilization
Critical Chemical Indicators for Ecosystem Response to Acidic Deposition Terrestrial Soil and soil water Ca/Al < 1 Soil base saturation < 20% Aquatic Surface waters pH < 6.0 ANC < 50 eq/L Al > 2 mol/L
SO4 (µeq/L) NO3 (µeq/L) ANC (µeq/L) pH Ali (µmol/L)
Model Predictions of the Response of Soil and Water to Acidic Deposition:Past and Future
BGC • Aqueous reactions • Surface reactions • Cation exchange • Adsorption • Humic binding • Aluminum dissolution/precipitation Wet Deposition Dry Deposition • Climatic data • Solar radiation • Precipitation • Temperature PnET Water balance Photosynthesis Living biomass Litterfall Net Mineralization Uptake Shallow water flow BGC – Surface water Aqueous reactions Deep water flow Weathering