Download
1 / 46
460 likes | 567 Views
Metrics of a System for Disaster Relief. Lynne Grewe California State University East Bay lynne.grewe@csueastbay.edu Presentation by Funda Erdin. Disaster Recovery. Issues. Disaster Incident Definition/Protocol Categories of Data representing Incident Methods of Data Capture

E N D
Metrics of a System for Disaster Relief Lynne Grewe California State University East Bay lynne.grewe@csueastbay.edu Presentation by FundaErdin
Issues • Disaster Incident Definition/Protocol • Categories of Data representing Incident • Methods of Data Capture • Data and Uncertainty Computer Representation • Fusion Processes to Reduce Data Size. • Storage and Data Distribution Needs • Personnel Roles and related Security Needs • Data Presentation • Communication Needs and Performance • Administration and Incident Control Tools
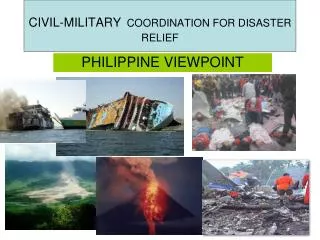
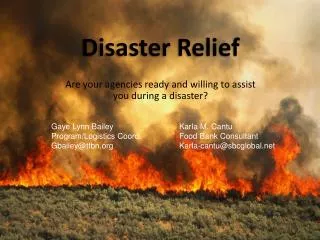
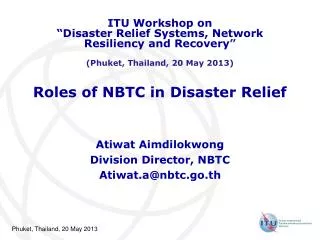
Previous Work • Currently, • mostly disaster relief is performed without any computer management tools as shown in images • Protocols (NIMS/ICS) • Describe human interactions … not as quantifiable as needed • Specialized Components • Some previous work concentrates on very specific issues (e.g. ambulance routing) • C3 related work • Command, Control, Communications – C3, US military related work, goals are not disaster relief
Our System: DiRecT(Disaster Recovery Tool) • Visualization • Uncertainty Visualization • Distributed Infrastructure • Communications Application of Mobile Agents • Protocol Structure • Client Control
DiRecT Server • EJB components for persistence and business logic • JMS and Mobile agents for instant-memoing • JMS for incident updates • Oracle database for persistence
DiRecT Field & Incident Command Clients • create a new incident • manage multiple incidents • request resources, personnel and equipment for a given incident • assignment of personnel
DiRecT Admin Client • Activation / Deactivation of incidents • Creation of new personnel, equipment and resources. • Assigning personnel to incidents • Fulfilling resource requests • Purging incidents from the database
Incident • Tracking of victims, personnel • Hazardous materials • Natural hazards response • Search-and-rescue missions • Fire control • Air, rail, ground, and water transportation accidents • Incidents with multiple casualties…and others. • Planned human events, e.g., large crowd gatherings, concerts, etc.
Incident Data • Many kinds of data possible, different operating units (firefighters, police, etc) may want different kinds of data. • DiRecT’s Data Categories • BioTargets (victims) • Search Areas • Equipment • Personnel • Hazards • Imagery
Data and Uncertainty Metric Goals • Quickly enter in data • Capture the essence of the underlying data • Allow for longer more narrative (open) forms of data capture optionally. • Have quantitative metrics when possible to make visualization easier and storage efficient. • Have metrics easily understood by all types of possible users. • Have metrics be intuitive when possible.
BioTarget Data Metrics • Capture common data • Quantize • Capture uncertainties. • Data measured: • Identity • Location • Health • Safety
Biotarget Data Capture • Identity
Biotarget Data Capture • Location
Biotarget Data Capture • Health
Biotarget Data Capture • Safety / Status
Search Area Metrics • Represent areas of search (or past search) • Typical geometries – rectangular, circular • Capture uncertainties. • Data measured: • Geometry size, shape, location, searching or searched
Search Area Data Capture • Give identity through name • Label as searching or searched • Give geometry and associated certainty of this
Equipment Data Metrics • Represents various kinds of equipment and resources in the field • Could be lots of different kinds of equipment • Data measured: • Identity, type, location
Equipment Data Capture • Give identity through name • Label Category or type in your own if not listed • Location same as biotarget data capture • Right screen shows listing of current equipment in Incident.
Personnel Data Metrics • Represents various personnel in the field (firefighters, police, etc). • Data measured: • Identity, personnel type, location
Personnel Data Capture • Give identity through name • Type indicates unit personnel belongs to. • Location same as BioTarget data capture
Hazard Data Metrics • Represents hazards in the scene. • Many kinds (fire, water, wind, etc). • Data measured: • Identity, location
Hazard Data Capture • Give identity through name, type, optional description, condition and certainty • Condition – scale of 0 to 100 indicating level of containment & severity. • 0 is contained/low level problem. • 100 is not contained/critical
Imagery Data Metrics • Represents raw imagery type data collected about incident. • Many kinds possible – photographic imagery, infra-red, maps, etc. • Data is ALREADY quantified • Problem here is to register the data against our Incident Visualization Grid so it can be fused. • Data measured: • File upload, User entered Registration points
Imagery Data Capture • Name of image layer • Activate layer or not • Data file • Registration information • Specified by user by clicking with mouse on upper-left and lower-left location ofimage boundaries. • Opacity control • Optional description • Rotation control
DiRecT Visualization • DiRecT take these data and certainty metrics and performs visualization
Some Visualization Cues • Opaqueness-Transparency • Icons/Glyphs • Color (pseudo-coloring or color representation) • Brightness/Intensity • Texture • Atmospheric Effects • Adding/Altering Geometry • Layers • Focus • Pop-up textual information • Animation • Morphing • Time Fading • Sounds (volume, key, duration, fade)
Biotarget Visualization • Iconic • Color • Transparency • Location • Bloom indicates BioTargetidenity type Indicates combined Healthand Safety w/Certainty indicates identity and presence certainty indicates location information indicates location certainty
Biotarget Color Color of Icon = F(Health,Saftey, Certainty) Red = Max(ColorSafetyR, ColorHealthR) Green =Min(ColorSafetyG,ColorHealthG) This visualization is intuitive. Red –alarm/high concern. Green – safe Yellow –caution/uncertain.
Example Visualiztion • Image, map, BioTargets, Search Areas, Equipment, Hazard and Personnel.
Visualization Control • Control clutter • Better Decisions • View only desired data
Infometrics – basic statistics about Incident. • Count • Search Search and highlight for biotargets Health <=60%
DiRecTInfrastructure Issues • Remote method invocations • Transparent fail-over • Back-end integration • Transactions • Clustering • Dynamic redeployment • Clean shutdown • Logging and auditing • Threading • Object life cycle • Resource pooling • Security • Caching • Communications
DiRecTCommunications • We can’t in the time allowed look at all the components of Infrastructure • Look at communications module • Performs a kind of “Instant- Memoing” for asynchronous communications in the field. • 2 implementations • Will look at Performance metrics
Aglets over JMS • Aglets can very easily and efficiently send private messages, while with JMS it is not so simple. • Aglets is explicitly asynchronous while JMS can be made asynchronous through durable subscriptions • Each mobile agent can carry different a encoding/decoding algorithm. • Agents can be controlled and can react dynamically to unfavorable situations on a host • JMS reliable, mature technology.
Performance Aglets over JMS • JMS Superior, especially as message size grows. • Aglets have some other possible advantages.
Future Work • Testing • System Integration • PDA, other devices • Predictive & Planning (AI) • Other forms of Media • User-specified/assigned visualization queues