Download

1 / 20
220 likes | 370 Views
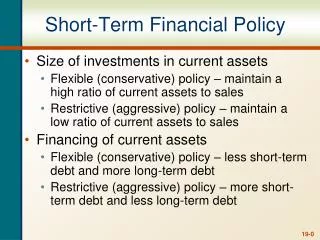
Chapter 23 Short-Term Financial Management. Professor XXXXX Course Name / Number. Time from the beginning of the production to the time when cash is collected from sale Financing the operating cycle is costly, so firms have an incentive to shrink it. Operating cycle. Cash conversion cycle.

E N D
Chapter 23Short-Term Financial Management Professor XXXXX Course Name / Number
Time from the beginning of the production to the time when cash is collected from sale • Financing the operating cycle is costly, so firms have an incentive to shrink it. Operating cycle Cash conversion cycle • Operating cycle less the average payment period on accounts payable The Cash Conversion Cycle
Time Line for the Operating and Cash Conversion Cycles for Reese Industries
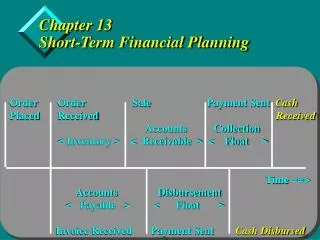
Shortening the Cash Conversion Cycle • To shorten a firm’s operating cycle or lengthen its payment period: • Turn over inventory as quickly as possible • Collect accounts receivable as quickly as possible • Pay accounts as slowly as possible • Reduce mail, processing, and clearing time
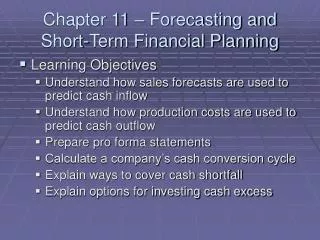
Inventory Management • Controlling inventory: • ABC System – inventory segregated into three groups, A, B, and C, from most costly to least costly investment. • Economic Order Quantity (EOQ) Model – • Reorder Points – Reorder point = lead time in days x daily usage • Safety Stock – determined by analyzing the probabilities of both increased usage rates and delivery delays • Material Requirements Planning – uses a master schedule • MRP II – uses a complex computer system to integrate data from many departments • Just-In-Time System - materials should arrive exactly when they are needed for production, rather than being stored on-site.
Determine its credit standards. • Set the credit terms. • Develop collection policy. • Monitor its A/R on both individual and aggregate basis. If a company decides to offer trade credit, it must: • Apply techniques to determine which customers should receive credit. • Use internal and external sources to gather information relevant to the decision to extend credit to specific customers. • Take into account variable costs of the products sold on credit. Credit standards Credit selection techniques Five C’s of Credit Credit scoring Accounts Receivable Management
Five C’s of Credit Framework for in-depth credit analysis that is typically used for high-dollar credit requests: • Character: The applicant’s record of meeting past obligations; desire to repay debt if able to do so • Capacity: The applicant’s ability to repay the requested credit • Capital: The financial strength of the applicant as reflected by its ownership position • Collateral: The amount of assets the applicant has available for use in securing the credit • Conditions: Refers to current general and industry-specific economic conditions
An example… • WEG Oil uses credit scoring to make credit decisions. WEG Oil decision rule is: • Credit Score > 75: extend standard credit terms • 65 < Credit Score < 75: extend limited credit (convert to standard credit terms after 1 year if account is properly maintained) • Credit Score < 65: reject application Credit Scoring Uses statistically-derived weights for key credit characteristics to predict whether a credit applicant will pay the requested credit in a timely fashion. • Used with high volume/small dollar credit requests • Most commonly used by large credit card operations, such as banks, oil companies, and department stores.
Financialand Credit Characteristics Score(0 to 100)(1) Predetermined Weight(2) Weighted Score[(1) X (2)](3) Credit references 80 0.15 12.00 Home ownership 100 0.15 15.00 Income range 75 0.25 18.75 Payment history 80 0.25 20.00 Years at address 90 0.10 9.00 Years on job 85 0.10 8.50 1.00 83.25 Credit Scoring of a Consumer Credit Application by WEG Oil
Increase in sales and profits (if positive contribution margin), but higher costs from additional A/R and additional bad debt expense. Credit standards relaxed Credit standards tightened • Reduced investment in A/R and lower bad debt, but lower sales and profit. • An example…YMC wants to evaluate the effects of a relaxation of its credit standards: • YMC sells CD organizers for $12/unit. All sales are on credit. YMC expects to sell 140,000 units next year. • Variable costs are $8/unit and fixed costs are $200,000 per year. • The change in credit standards will result in: • 5% increase in sales; average collection period will increase from 30 to 45 days; increase in bad debt from 1% to 2%. Changing Credit Standards
Marginal profit from increased sales Cost of marginal investment in A/R Average investment inaccounts receivable (AIAR) Effects of Changes in Credit Standards for YMC Additional profit contribution from sales Cost of the marginal investment in accounts receivables • To compute additional investment, use the following equations:
Total variable cost of annual sales (TVC) Turnover of account receivable (TOAR) Cost of the marginal investment in accounts receivables
Cost of marginalinvestment in A/R Cost of the marginal investment in accounts receivables Compute additional investment and, assuming a required return of 12%, compute cost of marginal investment in A/R.
Cost of marginal bad debt expense Marginal profit from increased sales Cost of marginalbad debts Net profit for the credit decision Cost of marginalinvestment in A/R = - - = $28,000 - $6,406 - $18,480 = $3,114 Cost of Marginal Bad Debt Expense 3. Cost of marginal bad debt expense Subtract the current level of bad debt expense (BDECURRENT) from the expected level of bad debt expense (BDEPROPOSED). 4. Net profit for the credit decision
Credit Terms • Terms of sale for customers: • Net 30 • End of month • Date of invoice • Cash discounts
The ongoing review of a firm’s accounts receivable to determine if customers are paying according to stated credit terms Credit monitoring Techniques for credit monitoring • Average collection period • Aging of accounts receivable • Payment pattern monitoring Average collection period: the average number of days credit sales are outstanding Credit Monitoring Aging of accounts receivable: schedule that indicates the portions of total A/R balance outstanding
Payment pattern: the normal timing within which a firm’s customers pay their accounts • Percentage of monthly sales collected the following month • Should be constant over time; if payment pattern changes, the firm should review its credit policies • An example… • DJM Manufacturing determined that: • 20% of sales collected in the month of sales, 50% in the next month and 30% two months after the sale. • Can use payment pattern to construct cash receipts from the cash budget: • If January sales are $400,000, DJM expects to collect $80,000 in January, $200,000 in February, and $120,000 in March. Credit Monitoring