Download
1 / 60
600 likes | 722 Views
Cooking with Sloan Color-Magnitude Diagram for Galaxies. Jordan Raddick The Johns Hopkins University American Astronomical Society summer meeting Calgary, AB. Outline. Welcome and introduction Set the table Introduce the kitchen Gather the ingredients Enjoy the feast. Welcome.

E N D
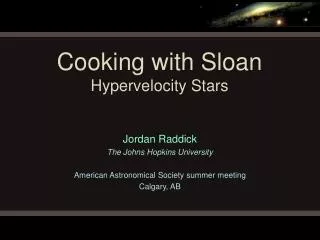
Cooking with SloanColor-Magnitude Diagram for Galaxies Jordan Raddick The Johns Hopkins University American Astronomical Society summer meeting Calgary, AB
Outline • Welcome and introduction • Set the table • Introduce the kitchen • Gather the ingredients • Enjoy the feast Cooking with Sloan: Color-Magnitude Diagram for Galaxies
Welcome • Purpose: Teach how to use SDSS data access tools for research • Rationale: Best to learn in specific context • Focus: Specific research questions • Rediscover recent interesting findings • Method: Interactive demo • Ask questions • Follow along on your laptop • Mood: fun Cooking with Sloan: Color-Magnitude Diagram for Galaxies
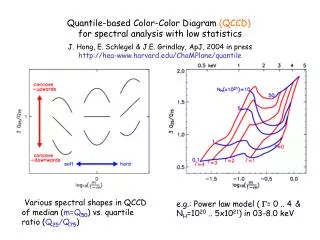
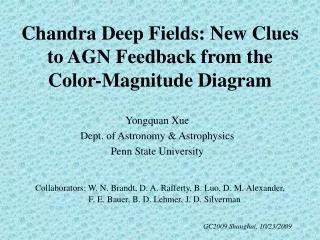
Scientific problems • Asteroid weathering • Nesvorny et al. 2005 • Hypervelocity stars • Brown et al. 2006 • Color-magnitude diagram for galaxies • Baldry et al. 2004 • Measuring the Hubble constant • Hubble 1929 Cooking with Sloan: Color-Magnitude Diagram for Galaxies
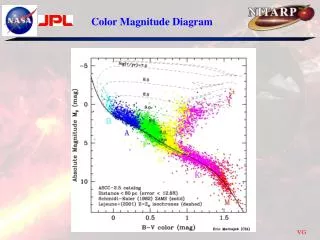
The Problem • Color-magnitude diagram of stars • Well-understood • Unlocked mysteries of stellar evolution • Picture for galaxies not so clear Cooking with Sloan: Color-Magnitude Diagram for Galaxies
The Problem • So how do we make progress? • One approach: morphology • But hard to get morphology of many small faint galaxies Cooking with Sloan: Color-Magnitude Diagram for Galaxies
One Solution • Get a representative sample • all galaxies in a certain magnitude range • Let’s try that approach with the SDSS Cooking with Sloan: Color-Magnitude Diagram for Galaxies
Introducing the SDSS Cooking with Sloan: Color-Magnitude Diagram for Galaxies
Participating Institutions • The American Museum of Natural History • Astrophysical Institute Potsdam • University of Basel • Cambridge University • Case Western Reserve University • University of Chicago • Drexel University • Fermilab • The Institute for Advanced Study • The Japan Participation Group • Johns Hopkins University • The Joint Institute for Nuclear Astrophysics • The Kavli Institute for Particle Astrophysics and Cosmology • The Korean Scientist Group • The Chinese Academy of Sciences (LAMOST) • Los Alamos National Laboratory • The Max-Planck-Institute for Astronomy (MPIA) • The Max-Planck-Institute for Astrophysics (MPA) • New Mexico State University • Ohio State University • University of Pittsburgh • University of Portsmouth • Princeton University • The United States Naval Observatory • The University of Washington (there are a lot of us) Cooking with Sloan: Color-Magnitude Diagram for Galaxies
The Telescope • 2.5 meter F/5 reflector • Very wide (~3 degree) field of view • Alt-az mount • Drift scanning Cooking with Sloan: Color-Magnitude Diagram for Galaxies
The Camera • CCD Imaging • 30 chips • 2048 x 2048 pixels • Arranged in six columns • Five rows for five filters: u, g, r, i, z • 54 second exposure time in each filter Cooking with Sloan: Color-Magnitude Diagram for Galaxies
Filter Profiles Cooking with Sloan: Color-Magnitude Diagram for Galaxies
Spectral Target Selection • All galaxies brighter than g < 17.77 • A luminous red galaxy sample • Quasar Candidates • “stars” with unusual colors • Objects with VLA FIRST or ROSAT matches Cooking with Sloan: Color-Magnitude Diagram for Galaxies
Spectrographs • Two fiber-fed spectrographs • Telescope tracks stars with plug plate in focal plane • Records 640 spectra simultaneously Cooking with Sloan: Color-Magnitude Diagram for Galaxies
Let’s start cooking… • Go to www.sdss.org • Read News • See Education • Click on Data Release 4 Cooking with Sloan: Color-Magnitude Diagram for Galaxies
Demo of DR4 site Cooking with Sloan: Color-Magnitude Diagram for Galaxies
Data Products Cooking with Sloan: Color-Magnitude Diagram for Galaxies
Data Access Methods • Data Archive Server (DAS) • http://das.sdss.org/DR4/data/ (or replace with DRx) • All the FITS data • Accessible via rsync, wget • Catalog Archive Server (CAS) • http://cas.sdss.org/ • All the catalog data (i.e. numbers) • Back end: MS SQL Server database management • Two distinct sites, both hosted at Fermilab • We’ll focus on the CAS Cooking with Sloan: Color-Magnitude Diagram for Galaxies
Why use databases? • Tycho Brahe’s notebooks • lifetime of work (1570-1601) • About 500 kB • POSS – 1950s • About 10 GB • SDSS – today • 3 TB • LSST – 2012 • 5 PB or more Cooking with Sloan: Color-Magnitude Diagram for Galaxies
Today’s tools, tomorrow’s data • You can… • GREP 1 MB in 1 second, FTP for < 1¢ • GREP 1 GB in 1 minute, FTP for $1 • GREP 1 TB in 2 days, FTP for $1,000 • GREP 1 PB in 3 years, FTP for $1,000,000 • …and 1 PB is 5,000 disks Cooking with Sloan: Color-Magnitude Diagram for Galaxies
Large-database science • Data in a database • Bring tools to data, not data to tools • Link data to literature Cooking with Sloan: Color-Magnitude Diagram for Galaxies
Types of Problems • Needles in haystacks • Brown dwarfs • Higgs particle • Disease-causing genes • Haystacks • Dark matter • Dark energy • Protein folding models • Needles are easier! • Our problem is “haystack” Cooking with Sloan: Color-Magnitude Diagram for Galaxies
Let’s see some galaxies… • Go to Catalog Archive Server (CAS) • Click “CAS” link on SDSS DR4 site • Go to http://cas.sdss.org • Go to www.google.com, type “CAS SDSS” • Notice Projects – great for your teaching! • Important: click “For Astronomers” • Now the site is optimized for you Cooking with Sloan: Color-Magnitude Diagram for Galaxies
Browse for Galaxies • http://cas.sdss.org/astro/ • Click on “Navigate” • Mapquest-likeinterface • Click on any object for data • Online notebook • Click “Explore” Cooking with Sloan: Color-Magnitude Diagram for Galaxies
Explore a Galaxy • Summary of image data and (if available) spectral data • Links to complete data • Get FITS of images (5 filters), spectrum Cooking with Sloan: Color-Magnitude Diagram for Galaxies
Explore a Galaxy • Links to NED, SIMBAD, ADS • Links to multiple SDSS observations • Print Cooking with Sloan: Color-Magnitude Diagram for Galaxies
Observe this Galaxy • Click image to go to Finding Chart • Enter ra, dec, scale (arcsec / pixel), image width • Print (inverted) • Point your telescope! Cooking with Sloan: Color-Magnitude Diagram for Galaxies
Searching the Database • Repeat as many times as you need to • But… there are 100 million galaxies! • How do you search the database? Cooking with Sloan: Color-Magnitude Diagram for Galaxies
Imaging Query Cooking with Sloan: Color-Magnitude Diagram for Galaxies
Spectro Query Cooking with Sloan: Color-Magnitude Diagram for Galaxies
Searching for Galaxies • Constraints from Baldry et al (2004): • Clean photometry (not NOPROFILE, PEAKCENTER, NOTCHECKED, PSF_FLUX_INTERP, SATURATED, or BAD_COUNTS_ERROR, DEBLEND_NOPEAK, or COSMIC_RAY) • Spectra available • In main galaxy sample (primTarget = GALAXY but not GALAXY_RED) Cooking with Sloan: Color-Magnitude Diagram for Galaxies
Searching for Galaxies • Constraints from Baldry et al (2004): • 13.5 < r < 17.77 • 0.004 < z < 0.08 • zconf > 0.35 • -23.5 < Mr < -15.5* • *to simplify, let’s assume Hubble cosmology: • -23.5 < r - 5*log10(4.27E+08*z) < -15.5 • Wait… you can’t specify that in the IQS! Cooking with Sloan: Color-Magnitude Diagram for Galaxies
SQL Searching • SQL – Structured Query Language • Common database access language • Industry standard, so students have practical advantages to learning • Allows advanced searches (“queries”) of data • Search using constraints on any variable • Return any or all types of data Cooking with Sloan: Color-Magnitude Diagram for Galaxies
SQL Concepts • Data are stored in a database • Similar data types are stored in tables • photoObj (photometry), specObj (spectroscopy), etc. • A VERY small part of the photoObj table: Cooking with Sloan: Color-Magnitude Diagram for Galaxies
SQL Concepts • Within a table: • Horizontal rows are individual data points, or records • Vertical columns are types of data, or columns • A request to a database to return data is called a query • Queries usually request data that meets certain constraints Cooking with Sloan: Color-Magnitude Diagram for Galaxies
SQL as a foreign language • Languages have grammar and vocabulary • Dutch grammar • With modal verb, auxiliary verb goes at the end • English: • I want TO SEE star positions. • Dutch: • Ik wil de posities van de sterren ZIEN. Cooking with Sloan: Color-Magnitude Diagram for Galaxies
SQL Grammar • Select – choose which columns of data you want to see • From – choose the table(s) from which you want to retrieve data • Where – set constraints on the search Cooking with Sloan: Color-Magnitude Diagram for Galaxies
Dutch vocabulary Cooking with Sloan: Color-Magnitude Diagram for Galaxies
SQL Vocabulary Cooking with Sloan: Color-Magnitude Diagram for Galaxies
Translations • English: • I want to see positions of 15th magnitude stars. • Dutch: • Ik wil de posities van de 15de magnitude sterren zien. • SQL: • select ra, decfrom starwhere r between 15 and 16 Cooking with Sloan: Color-Magnitude Diagram for Galaxies
SQL Help Resources • See Help link on SkyServer • Introduction to SQL • How-to -> Searching for Data • Sample SQL Queries • Query Limits • To submit a query, go to Tools -> Search -> SQL Search Cooking with Sloan: Color-Magnitude Diagram for Galaxies
Galaxy CMD Query select objid,ra,dec, modelmag_u,modelmag_g,modelmag_r,modelmag_i,modelmag_z, z,4.27E+3*z as d_hubble_mpc, modelmag_u-modelmag_r as u_minus_r, modelmag_r-5*log10(4.27E+8*z) as abs_mag_r from specphoto where specclass=2 AND modelmag_r between 13.5 and 17.7 AND ((flags & 0x10000000) != 0) AND ((flags & 0x8100000c00a0) = 0) AND (((flags & 0x400000000000) = 0) or (psfmagerr_g <= 0.2)) AND (((flags & 0x100000000000) = 0) or (flags & 0x1000) = 0) AND (primtarget & 0x00000040) > 0 AND (primtarget & 0x00000020) = 0 AND zConf > 0.35 AND z BETWEEN 0.004 and 0.08 AND modelmag_r - 5*log10(4.27E+08*z) BETWEEN -23.5 and -15.5 Cooking with Sloan: Color-Magnitude Diagram for Galaxies
First, a sanity check… • Advanced Tools -> Image Lists • Use query to fill form • Two changes • Add “TOP 50” • Select block must be ONLYname, ra, dec Cooking with Sloan: Color-Magnitude Diagram for Galaxies
We’re sane! Cooking with Sloan: Color-Magnitude Diagram for Galaxies
Running the Query • How many galaxies will we get? • Select count(*) ->n = 86,478 • That’s too many to use web browser • Solution: CasJobs Cooking with Sloan: Color-Magnitude Diagram for Galaxies
CasJobs • Advanced Tools -> CasJobs • Best method for fairly long, complex queries • Personal user DB (MyDB) • Quickmode: 1 minute cutoff (don’t need to register) • Register for… Cooking with Sloan: Color-Magnitude Diagram for Galaxies
CasJobs • Advanced Tools -> CasJobs • Submitmode: up to 8 hours in “long” queue • MyDB database to save results of your queries • Define your own functions, procedures • Share tables with collaborators (groups) • Job history, plotting, FITS/CSV/VOTable output Cooking with Sloan: Color-Magnitude Diagram for Galaxies
Run the Query in CasJobs • Go to “Query” • Select “DR4” as “Context” • Give results table a name (for your MyDB) • Give your query a name • Wait until it says “started” • Go play outside • When you return, results will be in MyDB Cooking with Sloan: Color-Magnitude Diagram for Galaxies
Results • Query ran in 1 min. 59 sec. • Varies due to server load Cooking with Sloan: Color-Magnitude Diagram for Galaxies
CasJobs Options • View data(preview) • Query your MyDB (just like SDSS tables) • Change context to “MyDB” • Job shows how table was created • Plot creates a simple x-y plot • Download lets you download data • CSV, FITS, XML • Neighbors lets you search around each object Cooking with Sloan: Color-Magnitude Diagram for Galaxies