Download
1 / 11
110 likes | 175 Views
Adding Phylogeny to GIS-enabled Species Range and Distribution Analyses. Jeffery Cavner, J.H. Beach, Aimee Stewart, CJ Grady jcavner@ku.edu, beach@ku.edu ,astewart@ku.edu, cjgrady@ku.edu Biodiversity Institute Natural History Museum University of Kansas. Lifemapper Range and Diversity (LmRAD).

E N D
Adding Phylogeny to GIS-enabled Species Range and Distribution Analyses • Jeffery Cavner, J.H. Beach, Aimee Stewart, CJ Grady • jcavner@ku.edu, beach@ku.edu ,astewart@ku.edu, cjgrady@ku.edu • Biodiversity Institute Natural History Museum University of Kansas
Lifemapper Range and Diversity (LmRAD) Presence Absence Matrix (PAM) Species Sites . .
Not just current PAMs but also future PAMs. PAMs can be built using species range predictions based on climate scenarios Species Richness calculated from PAMs for Brassicaceae for three climate scenarios
Not just ranges and richness Most existing indexes of biodiversity patterns can be calculated as combinations of vectors from the PAM
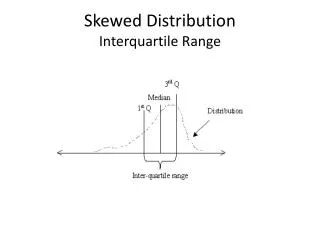
Just Four Vectors PAM, site i, species j Matrix of shared species in sites, NxN, where N are sites Matrix of co-occurrence of usage of sites by species, SxS, where S are species Species richness vector Range size of each species Using these simple relations we can obtain two other vectors. 1. The total sum of shared range sizes or Dispersion Field 2. The total number of shared community compositions or Diversity Field Diversity of sites and ranges of species are linked by a correlation between species diversity of sites and the mean range size of species occurring there; and by correlating the range size of species and the mean species diversity within those ranges. These relationships can be illustrated in range-diversity plots where the dispersion of points are defined by the degree of association among species, and the similarity of sites.
Sites Plot Similarity of Sites Equatorial Proportional Species Diversity Sudanian Savanna Madagascar Mediterranean- Sahara North → South Mean Proportional Range Size
Species Association Plot The average covariance of a species or its average association with all species determines the tendency for species to co-occur Proportional Range Size Mean Proportional Species Diversity Mean Proportional Species Diversity
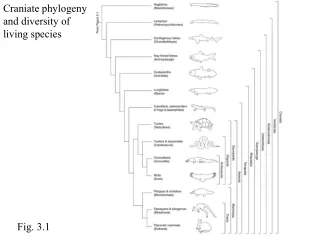
Phylogenetic Diversity P(D) Community Phylogenetic Distances D E F Mean pair-wise distance between all species in a community Mean distance to nearest taxon for each species in the community
Jeffery Cavner, J.H. Beach, Aimee Stewart, CJ Grady jcavner@ku.edu, beach@ku.edu, astewart@ku.edu, cjgrady@ku.edu Biodiversity Institute University of Kansas