Download
1 / 11
110 likes | 117 Views
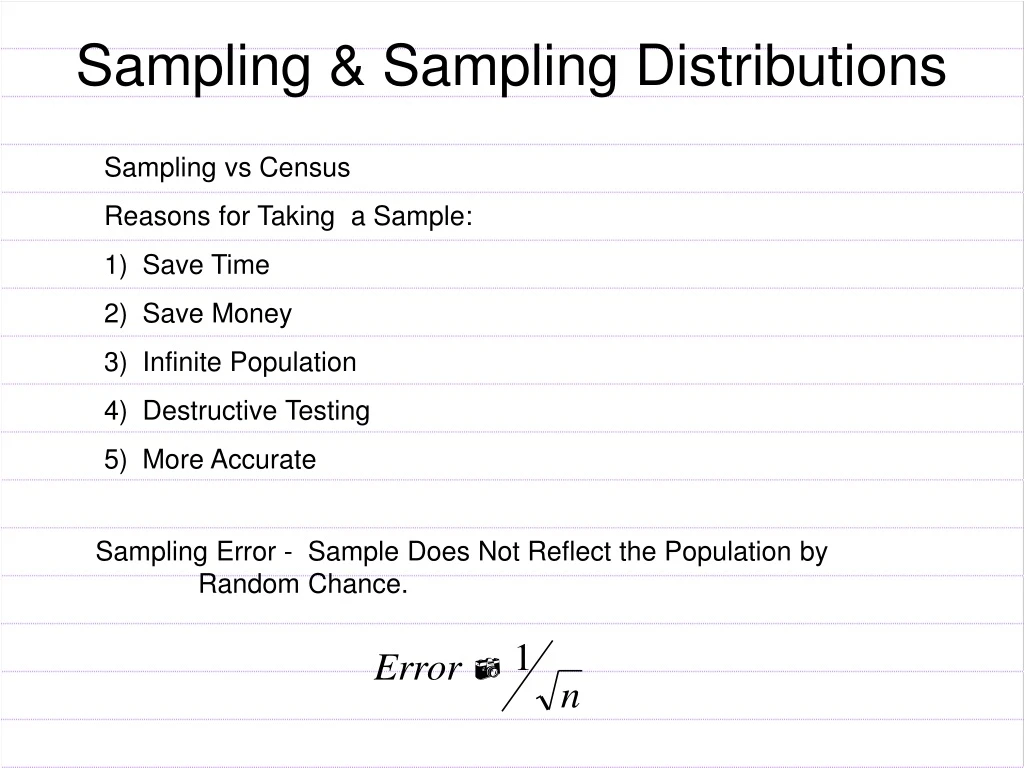
Sampling & Sampling Distributions. Sampling vs Census Reasons for Taking a Sample: Save Time Save Money Infinite Population Destructive Testing More Accurate. Sampling Error - Sample Does Not Reflect the Population by Random Chance.

E N D
Sampling & Sampling Distributions • Sampling vs Census • Reasons for Taking a Sample: • Save Time • Save Money • Infinite Population • Destructive Testing • More Accurate Sampling Error - Sample Does Not Reflect the Population by Random Chance.
Sampling Bias – Sample Does Not Reflect the Population because Certain Elements of the Population have a Higher Chance of Selection. Literary Digest Poll – 1936 Roosevelt 972,897 Landon 1,293,669 Bias of Non-Response Taking a Random Sample will Prevent Sampling Bias. Simple Random Sample – Each Element of the Population has equal Chance of Selection.
Ex: Simple Random Sample • Select 3 people from 8 people • Mary • Joni • Neil • Don • Linda • Paul • Mark • Jane Random Number Table
Modifications of Simple Random Sampling: Systematic Random Sample – A Few Random Selections Force the other Selections Stratified Random Sample – Divide Population into Strata Cluster Sampling – Divide Population into Clusters (Areas)
Sampling Distribution for Sample Mean Ex: Population X | 1 2 3 4 5 µ = 3 P(X) | 1/5 1/5 1/5 1/5 1/5 σ2 = 2 Sample 2 Rolls from this Population: {1,1} {2,1} {3,1} {4,1} {5,1} {1,2} {2,2} {3,2} {4,2} {5,2} {1,3} {2,3} {3,3} {4,3} {5,3} {1,4} {2,4} {3,4} {4,4} {5,4} {1,5} {2,5} {3,5} {4,5} {5,5} Find the Sample Mean for these Samples
Sample Mean Distribution: • X | P(X) X•P(X) (X-µ) (X-µ)2 (X-µ)2•P(X) • | 1/25 • 1.5 | 2/25 • | 3/25 • 2.5 | 4/25 • | 5/25 • 3.5 | 4/25 • | 3/25 • 4.5 | 2/25 • 5 | 1/25
Central Limit Theorem – The Distribution for the Sample Mean, X, is Approximately Normal for a Large Enough Sample Size (n ≥30), And and
Z Formula for Sample Mean Transformation to Standardized Normal Curve Ex: Male Heights are Normally Distributed with a Mean of 70” Std Dev of 3” P(X > 72”) = If n = 4, P( > 72”) =
Sampling from a Finite Population • Finite Correction Factor • Modified Z Formula Use If n > .05•N