Download
1 / 66
660 likes | 812 Views
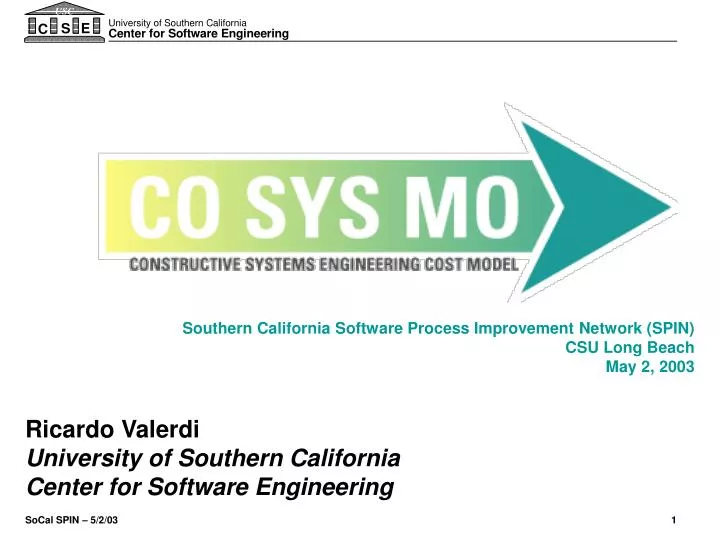
Southern California Software Process Improvement Network (SPIN) CSU Long Beach May 2, 2003. Ricardo Valerdi University of Southern California Center for Software Engineering. Outline. Goals of this workshop Background, key ideas, and definitions Overview of COSYSMO <coffee break>

E N D
Southern California Software Process Improvement Network (SPIN) CSU Long Beach May 2, 2003 Ricardo Valerdi University of Southern California Center for Software Engineering
Outline • Goals of this workshop • Background, key ideas, and definitions • Overview of COSYSMO • <coffee break> • Estimation example • Challenges • Data collection process • Demo
Goals of this workshop • What is the difference between COCOMO II and COSYSMO? • What does a parametric cost model look like? • How can I use COSYSMO to justify Systems Engineering decisions? • What factors have the greatest impact on Systems Engineering effort? • Where is CMMISM in all of this?
“All models are wrong, but some of them are useful” - W. E. Deming Source: www.deming.org
Key Definitions & Concepts Calibration: the tuning of parameters based on project data CER: a model that represents the cost estimating relationships of factors Cost Estimation: prediction of both the person-effort and elapsed time of a project Driver: A factor that is highly correlated to the amount of Systems Engineering effort Parametric: an equation or model that is approximated by a set of parameters Rating Scale: a range of values and definitions for a particular driver Understanding: an individual’s subjective judgment of their level of comprehension
COCOMO II • COCOMO is the most widely used, thoroughly documented and calibrated software cost model • COCOMO - the “COnstructive COst MOdel” • COCOMO II is the update to COCOMO 1981 • ongoing research with annual calibrations made available • Originally developed by Dr. Barry Boehm and published in 1981 book Software Engineering Economics • COCOMO II described in Software Cost Estimation with COCOMO II (Prentice Hall 2000)
CMMISM • Capability Maturity Model Integration • Level 2 Managed: Estimates of project planning parameters are maintained • Level 3 Defined: Analysis of cost and cost drivers • You can’t do good Software Engineering without Systems Engineering
The CMMI Software Paradigm Shift • The traditional software paradigm • Relation to SW CMM v.1.1 • Problems with traditional paradigm • The CMMI software paradigm • Specific process area differences • Resulting implementation challenge Source : CS577b Course - USC
The Traditional Software Paradigm • System engineers establish system requirements • Allocate some to software • Software engineers build software to requirements • And do their requirements management • System engineers integrate software into system Source : CS577b Course - USC
The Gospel According to SW CMM v.1.1 • Requirements Management, Ability 1 • “Analysis and allocation of the system requirements • is not the responsibility of the software engineering group • but is a prerequisite for their work.” Source : CS577b Course - USC
Resulting Project Social Structure Source : CS577b Course - USC
The CMMI Software Paradigm System and software engineering are integrated Software has a seat at the center table Requirements, architecture, and process are developed concurrently Along with prototypes and key capabilities Developments done by integrated teams Collaborative vs. adversarial process Based on shared vision, negotiated stakeholder concurrence Tune in next month for Dr. Hefner’s talk… Source : CS577b Course - USC
USC Center for Software Engineering (CSE) • Researches, teaches, and practices CMMI-based Software engineering • Systems and software engineering fully integrated • Collaborative efforts between Computer Science (CS) and Industrial Systems Engineering (ISE) Departments • COCOMO Suite of models • Cost, schedule: COCOMO II, CORADMO, COCOTS • Quality: COQUALMO • Systems Engineering: COSYSMO • Applies and extends research on major programs (DARPA/Army, FCS, FAA ERAM, NASA Missions) • Uses mature 7-step model development methodology
7-step Modeling Methodology Analyze Existing literature Perform Behavioral Analysis 1 Identify Relative Significance 2 Perform Expert- Judgement, Delphi Assessment 3 4 Gather Project Data Determine Bayesian A-Posteriori Update 5 Gather more data; refine model 6 Determine statistical significance 7
Organizations actively involved with COSYSMO • Commercial Industry (1) • Galorath • Aerospace Industry (5) • BAE, Lockheed Martin, Northrop Grumman, Raytheon, SAIC • Government (2) • NAVAIR, US Army Research Labs • FFRDC’s and Consortia (2) • Aerospace, SPC • Technical Societies (3) • INCOSE, ISPA, PSM
Estimation Accuracy 4x 2x Relative Size Range x 0.5x Initial Operating Capability OperationalConcept Life Cycle Objectives Life Cycle Architecture 0.25x Feasibility Plans/Rqts. Design Develop and Test Phases and Milestones
COCOMO II Model Differences COSYSMO • Software • Development phases • 20+ years old • 200+ calibration points • 23 Drivers • Variable granularity • 3 anchor points • Size is driven by SLOC • Systems Engineering • Entire Life Cycle • 2 years old • ~3 calibration points • 18 drivers • Fixed granularity • No anchor points • Size is driven by requirements, I/F, etc
Outline • Goals of this workshop • Background, key ideas, and definitions • Overview of COSYSMO • <coffee break> • Estimation example • Challenges • Data collection process • Demo
COSYSMO: Overview • Parametric model to estimate system engineering costs • Includes 4 size & 14 cost drivers • Covers full system engineering lifecycle • Focused on use for Investment Analysis, Concept Definition phases estimation, tradeoff & risk analyses • Input parameters can be determined in early phases
COSYSMO Operational Concept # Requirements # Interfaces # Scenarios # Algorithms + Volatility Factor Size Drivers COSYSMO Effort Effort Multipliers • Application factors • 8 factors • Team factors • 6 factors • Schedule driver Calibration WBS guided by ISO/IEC 15288
System life Process description ISO/IEC 15288 EIA/ANSI 632 High level practices Level of detail IEEE 1220 Detailed practices Operate, Maintain, or Enhance Transition to Operation Replace or Dismantle Conceptualize Develop Purpose of the Standards: ISO/IEC 15288 - Establish a common framework for describing the life cycle of systems EIA/ANSI 632 - Provide an integrated set of fundamental processes to aid a developer in the engineering or re-engineering of a system IEEE 1220 - Provide a standard for managing systems engineering Breadth and Depth of Key SE Standards Source : Draft Report ISO Study Group May 2, 2000
ISO/IEC 15288 Key Terms • System • a combination of interacting elements organized to achieve one or more stated purposes • System-of-Interest • the system whose life cycle is under consideration in the context of this International Standard • System Element • a member of a set of elements that constitutes a system NOTE: A system element is a discrete part of a system that can be implemented to fulfill specified requirements • Enabling System • a system that complements a system-of-interest during its life cycle stages but does not necessarily contribute directly to its function during operation NOTE: For example, when a system-of-interest enters the production stage, an enabling production system is required Source: ISO/IEC 15288.
ISO/IEC 15288 System of Interest Structure System Integrator SBIRS or FCS Prime Make or buy Subcontractor 2nd tier sub 3rd tier sub Source: ISO/IEC 15288.
COSYSMO Evolution Path Operate, Maintain, or Enhance Transition to Operation Replace or Dismantle Oper Test & Eval Conceptualize Develop Global Command and Control System 1. COSYSMO-IP Include ISO/IEC 15288 Stages 2. COSYSMO-C4ISR Satellite Ground Station 3. COSYSMO-Machine Joint Strike Fighter 4. COSYSMO-SoS Future Combat Systems
COCOMO-based Parametric Cost Estimating Relationship Where: PMNS = effort in Person Months (Nominal Schedule) A = constant derived from historical project data Size = determined by computing the weighted average of the size drivers E = exponent for the diseconomy of scale dependent on size drivers (4) n = number of cost drivers (14) EM = effort multiplier for the ith cost driver. The geometric product results in an overall effort adjustment factor to the nominal effort.
4 Size Drivers • Number of System Requirements • Number of Major Interfaces • Number of Operational Scenarios • Number of Critical Algorithms • Each weighted by complexity, volatility, and degree of reuse
Number of System Requirements This driver represents the number of requirements for the system-of-interest at a specific level of design. Requirements may be functional, performance, feature, or service-oriented in nature depending on the methodology used for specification. They may also be defined by the customer or contractor. System requirements can typically be quantified by counting the number of applicable “shall’s” or “will’s” in the system or marketing specification. Do not include a requirements expansion ratio – only provide a count for the requirements of the system-of-interest as defined by the system or marketing specification.
Number of Major Interfaces This driver represents the number of shared major physical and logical boundaries between system components or functions (internal interfaces) and those external to the system (external interfaces). These interfaces typically can be quantified by counting the number of interfaces identified in either the system’s context diagram and/or by counting the significant interfaces in all applicable Interface Control Documents.
Number of Operational Scenarios This driver represents the number of operational scenarios that a system must satisfy. Such threads typically result in end-to-end test scenarios that are developed to validate the system and satisfy all of its requirements. The number of scenarios can typically be quantified by counting the number of unique end-to-end tests used to validate the system functionality and performance or by counting the number of high-level use cases developed as part of the operational architecture.
Number of Critical Algorithms This driver represents the number of newly defined or significantly altered functions that require unique mathematical algorithms to be derived in order to achieve the system performance requirements. As an example, this could include a complex aircraft tracking algorithm like a Kalman Filter being derived using existing experience as the basis for the all aspect search function. Another example could be a brand new discrimination algorithm being derived to identify friend or foe function in space-based applications. The number can be quantified by counting the number of unique algorithms needed to support each of the mathematical functions specified in the system specification or mode description document.
Outline • Goals of this workshop • Background, key ideas, and definitions • Overview of COSYSMO • <coffee break> • Estimation example • Challenges • Data collection process • Demo
14 Cost Drivers Application Factors (8) • Requirements understanding • Architecture complexity • Level of service requirements • Migration complexity • Technology Maturity • Documentation Match to Life Cycle Needs • # and Diversity of Installations/Platforms • # of Recursive Levels in the Design
Requirements understanding This cost driver rates the level of understanding of the system requirements by all stakeholders including the systems, software, hardware, customers, team members, users, etc.
Architecture complexity This cost driver rates the relative difficulty of determining and managing the system architecture in terms of platforms, standards, components (COTS/GOTS/NDI/new), connectors (protocols), and constraints. This includes tasks like systems analysis, tradeoff analysis, modeling, simulation, case studies, etc.
Level of service (KPP) requirements This cost driver rates the difficulty and criticality of satisfying the ensemble of Key Performance Parameters (KPP), such as security, safety, response time, interoperability, maintainability, the “ilities”, etc.
Migration complexity This cost driver rates the complexity of migrating the system from previous system components, databases, workflows, environments, etc., due to new technology introductions, planned upgrades, increased performance, business process reengineering, etc.
Technology Maturity The maturity, readiness, and obsolescence of the technology being implemented.
Documentation match to life cycle needs The breadth and depth of documentation required to be formally delivered based on the life cycle needs of the system.
# and diversity of installations/platforms The number of different platforms that the system will be hosted and installed on. The complexity in the operating environment (space, sea, land, fixed, mobile, portable, information assurance/security). For example, in a wireless network it could be the number of unique installation sites and the number of and types of fixed clients, mobile clients, and servers. Number of platforms being implemented should be added to the number being phased out (dual count).
# of recursive levels in the design The number of levels of design related to the system-of-interest and the amount of required SE effort for each level.
14 Cost Drivers (cont.) Team Factors (6) • Stakeholder team cohesion • Personnel/team capability • Personnel experience/continuity • Process maturity • Multisite coordination • Tool support
Stakeholder team cohesion Represents a multi-attribute parameter which includes leadership, shared vision, diversity of stakeholders, approval cycles, group dynamics, IPT framework, team dynamics, trust, and amount of change in responsibilities. It further represents the heterogeneity in stakeholder community of the end users, customers, implementers, and development team.
Personnel/team capability Basic intellectual capability of a Systems Engineer to analyze complex problems and synthesize solutions. Personnel experience/continuity The applicability and consistency of the staff at the initial stage of the project with respect to the domain, customer, user, technology, tools, etc.
Process maturity Maturity per EIA/IS 731, SE CMM or CMMI.
Multisite coordination Location of stakeholders, team members, resources, corporate collaboration barriers.
Tool support Coverage, integration, and maturity of the tools in the Systems Engineering environment.
Additional Proposed Drivers • # of recursive levels in the design • # and diversity of installations/platforms • # and diversity of installations/platforms • phased out • # of years in operational life cycle • Quality Attributes • Manufacturability/Producibility • Degree of Distribution
Delphi Round 1 Highlights Range of sensitivity for Size Drivers 6.48 5.57 6 Relative Effort 4 2.54 2.10 2.21 2.23 2 1 # TPM’s # Modes # Scenarios # Algorithms # Platforms # Interfaces # Requirements
Delphi Round 1 Highlights (cont.) Range of sensitivity for Cost Drivers (Application Factors) 4 EMR 2.81 2.43 2.24 2.13 2 1.13 1.74 1.93 COTS Legacy transition Architecture und. Platform difficulty Requirements und. Bus. process reeng. Level of service reqs.
Delphi Round 1 Highlights (cont.) Range of sensitivity for Cost Drivers (Team Factors) 4 EMR 2.46 2.16 1.91 1.94 1.78 1.84 2 1.25 1.28 Tool support Multisite coord. Process maturity Formality of deliv. Stakeholder comm. Personnel capability Stakeholder cohesion Personal experience