Download
1 / 35
350 likes | 480 Views
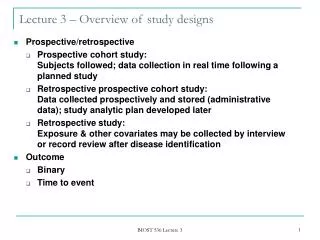
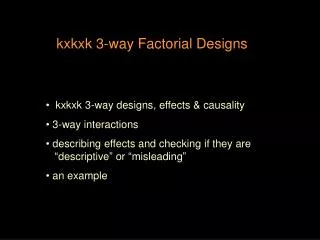
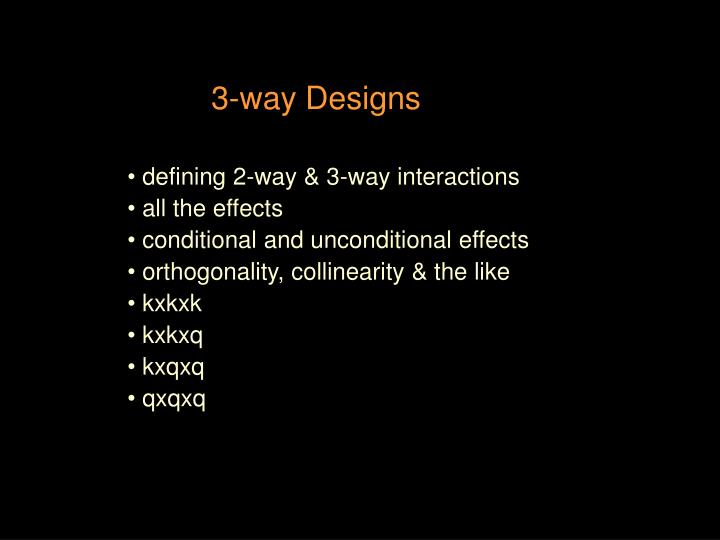
3-way Designs. defining 2-way & 3-way interactions all the effects conditional and unconditional effects orthogonality, collinearity & the like kxkxk kxkxq kxqxq qxqxq. A 2-way interaction… “emerges” when there are 2 IVs (categorical or quant)

E N D
3-way Designs • defining 2-way & 3-way interactions • all the effects • conditional and unconditional effects • orthogonality, collinearity & the like • kxkxk • kxkxq • kxqxq • qxqxq
A 2-way interaction… • “emerges” when there are 2 IVs (categorical or quant) • is the non-additive/joint effect of the 2 IVs • usually describes as “when the effect of one IV is different for different values of the 2nd IV” • Expanding this to define 3-ways… • “emerges” when there are 3 IVS (categorical or quant) • is non-additive/joint effect of the 3 IVs • usually identified as the “when the 2-way interaction of 2 IVs is different for different values of the 3rd IV”
We are going to focus on “full model” 3-ways – designs that have all possible interactions included • For a design with the A, B & C IVs/predictors there will be 7 “unconditional effects” • All of these effects have the tag “… controlling for the other effects in the model .” • AxBxC 3-way interaction – joint effect of A, B & C… • AxB 2-way interaction – joint effect of A & B… • AxC 2-way interaction – joint effect of A & C… • BxC 2-way interaction – joint effect of B & C… • A main effect – effect of A… • B main effect – effect of B… • C main effect – effect of C…
There are lots of simple/conditional effects we might consider • Each of these looks at one of the lower-order 2-way or main effects at a specific value of the other IV(s) Simple AxB interaction at different values of C Simple AxC interaction at different values of B Simple BxC interaction at different values of A Simple effect of A at different combinations of B & C values Simple effect of B at different combinations of A & C values Simple effect of C at different combinations of A & B values
Having all these different “effects” raises three important issues for all analyses…. #1 How do we choose to represent and describe the model, . especially the 3-way interaction ?? #2 What do the lower-order terms tell us ?? #2a Do the lower-order terms represent and allow an . inference to populations that we care about and tell us . useful information?? #2b Whether the lower-order terms are “descriptive,” . “misleading” or “potentially misleading” ????
#1 Based on the definition of a 3-way, we have three choices about how to depict and describe the 3-way interaction… Simple AxB interaction at different values of C Simple AxC interaction at different values of B Simple BxC interaction at different values of A Which to choose? 1st pick the variable that is most important to you – which IV is most central in your thinking about the DV/behavior you are studying? 2nd figure out which of the other two IVs you are most interested in understanding how it changes or moderates the IV you care about most. Now you know which 2-way you’ll use to figure out the 3-way!
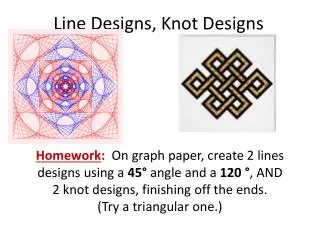
Stimulus Type Shape Texture #Practices #Practices 1 10 1 10 Modality Vision Touch 90 90 70 80 60 70 70 80 Notice that this layout was chosen to portray the 3-way as how the simple 2-way interaction of ModalityxPractice is different for Shape v Texturestimuli. We can then express the simple 2-ways as either modality effects for each # practices or # practice effects for each modality
#2a Related to this is the very important issue of whether or not the 2-way interactions and main effects that are part of the 3-way design “mean anything to us” ??? It all goes back to “representation & inference” !!! Remember – the purpose of any IV condition or value is to represent some population so we can infer that the difference between those IV conditions or values represent differences between the populations we really care about! The “cells” in the 3-way each represent a specific population and so, comparisons between them are comparisons between out target populations. But the means/values of all the lower-order effects are “aggregates” – who do they represent???
Let’s use a simpler 2-way model to consider this… We know what population is represented by each of the four cell means! 55 What about the marginal mean for “Paper Presentation” the aggregate of Easy & Hard Difficulty… 65 Does it represent “any difficulty”… “medium difficulty” ??? What about the marginal mean “Hard Task Difficulty”??? What population is represented by the aggregate of Paper & Computer Task Presentations????
#2b Related to the “meaningfullness” issue, and perhaps the most difficult part about working with these larger 3-way designs is determining which of the lower-order effects (2-ways and main effects) are “descriptive” and which are “misleading” • Here’s the rule: • Any lower-order effect that is involved in a significant higher-order effect is suspect! • You must check if that lower order effect is descriptive or misleading… • … by comparing the pattern of the lower order effect with the pattern of all corresponding simple effects at all combinations of the other variables involved in the higher order effect!
Let’s start by looking at a couple of 2-ways… Notice that the main effect of Task Presentation has the same pattern as thesimple effect of Task Presentation at each level of Task Difficulty. So, the main effect of Task Presentation is descriptive!
Notice that the main effect of Task Presentation does not havethe same pattern as thesimple effect of Task Presentation at each level of Task Difficulty. So, the main effect of Task Presentation is potentially misleading – descriptive for Hard, but misleading for Easy!
Notice that the main effect of Task Presentation does not havethe same pattern as thesimple effect of Task Presentation at either level of Task Difficulty. So, the main effect of Task Presentation is misleading – descriptive for neither Hard nor Easy!
This one is very important – it causes the most mistakes… Notice that the main effect of Task Presentation does not havethe same pattern as thesimple effect of Task Presentation at either level of Task Difficulty. So, the null main effect of Task Presentation is misleading – descriptive for neither Hard nor Easy!
Back to 3-ways… • In a 3-way effect we have 6 lower-order effects • 3 2-way interactions • 3 Main effects • Based on the last part There are 2 situations when we will care! • #1 if the aggregates compared in the effect represent a target population that we care about! • #2 when the effect is descriptive, and can be used to generalize from the aggregate to all the separate conditions/values (in the current study/design) For each lower-order effect we have to decide… Do we care??? If the aggregates represent meaningful populations, but the effect is misleading we’ll have to carefully describe the situation – when the pattern is descriptive and misleading, etc. If the effect is neither representative not a useful general description, then we may not care about the effect !!!
#2a Related to this is the very important issue of whether or not the 2-way interactions and main effects that are part of the 3-way design “mean anything to us” ??? It all goes back to “representation & inference” !!! Remember – the purpose of any design condition or value is to represent some population so we can infer that the difference between those conditions or values in the design represent differences between the populations we really care about! The “cells” in the 3-way each represent a specific population and so, comparisons between them are comparisons between out target populations. But the means/values of all the lower-order effects are “aggregates” – who do they represent???
Let’s use a simpler 2-way model to consider this… We know what population is represented by each of the four cell means! 60 What about the marginal mean for “Paper Presentation” the aggregate of Easy & Hard Difficulty… 60 Does it represent “any difficulty”… “medium difficulty” ??? What about the marginal mean “Hard Task Difficulty”??? What population is represented by the aggregate of Paper & Computer Task Presentations????
Let’s take a look at the four kinds of 3-ways, considering how the effects are portrayed and described… kxkxk all 3 are categorical/qualitative “IVs” often called a “3-way Factorial ANOVA Design” all interactions usually included kxkxq 2 categorical/qualitative “IVs” & 1 quant “covariate” often called a “2-way factorial ANCOVA Design” usually the interaction of the 2 IVs is included kxqxq 1 categorical/qualitative “IV” & 2 quant “covariates” often called an “ANCOVA with 2 covariates” usually no interactions are included qxqxq all 3 are quantitative “predictors” if no interactions – usually called a “multiple regression” if interactions – usually called a “moderated regression” We will include all the interactions in all the models !!!
kxkxk Stimulus Type Shape Texture #Practices #Practices 1 10 1 10 Modality Vision Touch Bimodal
kxkxk Effects for this Design 3-way interaction of x Modality x Practice 2-way interaction of Stimulus x Modality 2-way interaction of Stimulus x Practice 2-way interaction of Modality x Practice Main effect of Stimulus Main effect of Modality Main effect of Practice Simple interaction of Stimulus x Modality at dif values of Practice Simple interaction of Stimulus x Practice at dif values of Modality Simple interaction of Modality x Practice at dif values of Stimulus Simple effect of Stimulus at dif combos of Modality & Practice Simple effect of Modality at dif combos of Stimulus & Practice Simple effect of Practice at dif combos of Modality & Practice
kxkxk 100 90 80 70 60 50 Vision Touch Bimodal 10 Practices 1 Practice Shape Texture
kxkxk 100 90 80 70 60 50 P E R F O R M A N C E 1 Practices 10 Vision Touch Bimodal Shape Texture
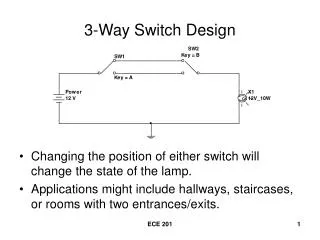
kxkxq Trainer Unfamiliar Familiar Group Size Large Group Small Group Individual Quantitative “covariate” was Motivation
kxkxq Effects for this Design 3-way interaction of Group Size x Trainer x Motivation 2-way interaction of Group Size x Trainer 2-way interaction of Group Size x Motivation 2-way interaction of Trainer x Motivation Main effect of Group Size Main effect of Trainer Main effect of Motivation Simple interaction of Group Size x Trainer at dif values of Motivation Simple interaction of Group x Motivation at dif values of Trainer Simple interaction of Trainer x Motivation at dif values of Group Size Simple effect of Group Size at dif combos of Trainer & Motivation Simple effect of Trainer at dif combos of Group Size & Motivation Simple effect of Motivation at dif combos of Group Size & Trainer
kxkxq P E R F O R M A N C E 950 900 850 800 750 700 20 30 40 50 60 70 Motivation Large Group Small Group Individual Unfamiliar Familiar
kxqxq Location Friend’s Stanger’s House House Quantitative “covariates” were: Guest Familiarity Social Skills
kxqxq Effects for this Design 3-way interaction of Location x Familiarity x SoSkill 2-way interaction of Location x Familiarity 2-way interaction of Location x SoSkill 2-way interaction of Familiarity x SoSkill Main effect of Location Main effect of Familiarity Main effect of SoSkill Simple interaction of Location x Familiarity at dif values of SoSkill Simple interaction of Location x SoSkill at dif values of Familiarity Simple interaction of Familiarity x SoSkill at dif values of Location Simple effect of Location at dif combos of Familiarity & SoSkill Simple effect of Familiarity at dif combos of Location & SoSkills Simple effect of SoSkills at dif combos of Familiarity & Location
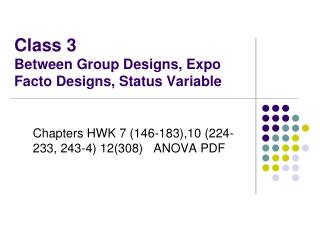
kxqxq P E R F O R M A N C E 450 400 350 300 250 200 20 30 40 50 60 70 Social Skills High Guest Familiarity Medium Guest Familiarity Low Guest Familiarity Friend’s House Stranger’s House
qxqxq Quantitative “predictors” were: Stress Social Support Income
qxqxq Effects for this Design 3-way interaction of Stress x SoSupp x Income 2-way interaction of Stress x SoSupp 2-way interaction of Stress x Income 2-way interaction of SoSupp x Income Main effect of Stress Main effect of SoSupp Main effect of Income Simple interaction of Stress x SoSupp at dif values of Income Simple interaction of Stress x Income at dif values of SoSupp Simple interaction of SoSupp x Income at dif values of Stress Simple effect of Stress at dif combos of SoSupp & Income Simple effect of SoSupp at dif combos of Stress & Income Simple effect of Income at dif combos of Stress & SoSupp
qxqxq D e p r e s s i o n 450 400 350 300 250 200 5 10 15 20 25 30 Stress High Social Support Medium Social Support Low Social Support High Income Medium Income Low Income