Download
1 / 36
360 likes | 622 Views
Measuring Neighborhood Environment. TICR Epi 222. Irene Yen Department of Medicine. May 1,, 2008. Outline of today’s lecture. Neighborhood-Health overviews. Administrative Data. Survey assessment of perceived neighborhood. Direct observation.

E N D
Measuring Neighborhood Environment TICR Epi 222 Irene Yen Department of Medicine May 1,, 2008
Outline of today’s lecture Neighborhood-Health overviews Administrative Data Survey assessment of perceived neighborhood Direct observation Geographic Information Systems (GIS) / spatial data 2
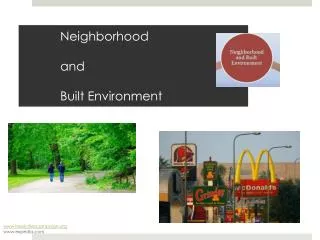
What is neighborhood? • People – composition • % poverty level incomes • % unemployed • People – relationships (social environment) • Collective efficacy • Social support • Physical/Built environment • Green space / parks • Roads • Housing
What is neighborhood – part II • Public services • Public transit • police • Commercial services • grocery • Retail stores
Neighborhood-Health Connections • 2001-2006; 235 articles study neighborhood-health • Main outcomes of interest: • Self-reported health • Chronic disease • Injury alcohol violence • Health behaviors • Mortality
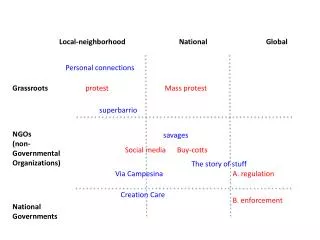
Neighborhood environment – health disparities • Policies that create diversity in neighborhoods: • public investment • zoning • Characteristics of neighborhoods • Composition: poverty, segregation • “built environment”: stores, parks, trees • Social environment: threats, social cohesion
Neighborhood - Definitions • Census boundaries • Zip code • ½ mile around home • Perceived – no concrete definition
Neighborhood - Measures Administrative data: census, city planning zoning perceptions Direct observation Geospatial data
Part I. Administrative data
Census variables - examples • Family income - Median income for all households • Poverty - Proportion of persons whose annual income falls at or below 175% of the poverty line • Education - Proportion of persons 25 years and older with less than a high school education • Housing value - Median value of owner-occupied housing units
Is neighborhood environment associated with mortality? Alameda County Study *1983 data - 50% sample (n=1,799)*Alameda County residents in 1983 (n=1,129)*neighborhood defined as census tract Yen IH, Kaplan GA. American Journal of Epidemiology 1999
Chicago School of Sociology CityCenter Transition Workers’ homes Residential Commuter Yen IH, Syme SL. Annual Review of Public Health 1999
Is neighborhood environment associated with mortality? Alameda County Study Commercial Services • Supermarkets • Laundromats / Dry cleaners • Beauty Parlor / Barber Ships • Pharmacies Environment/Housing • Total population of census tract • Area of census tract • % renters • % single family dwellings Community SES • Per capita income • % white collar employees • crowding Yen IH, Kaplan GA. American Journal of Epidemiology 1999
Low social environmental quality and 11-year mortality risk 2-level logistic regression; Alameda County Study 1983 (n=996) Yen IH, Kaplan GA. American Journal of Epidemiology 1999
Commercial services and 11-year mortality risk 2-level logistic regression; Alameda County Study 1983 (n=996) Yen IH, Kaplan GA. American Journal of Epidemiology 1999
6 High Income 5 Low income 4 3 2 1 0 Lowest community SES Highest community SES Community SES & 11-year Mortality Risk By individual income level Odds Ratio Yen IH, Kaplan GA. American Journal of Epidemiology 1999
Part III. Survey assessment of perceived neighborhood
What happens when we measure perceived neighborhood environment? Self-administered questions over-ride limitation of census boundaries
UCSF Asthma and Rhinitis Panel • began in 1992 • sample of patients with asthma from northern California physicians (RDD sample added in 1999). • ages 18 to 50 at baseline • Wave 5 (Feb 2000 – May 2001); n=439 Yen IH, et al. Am J Public Health 2006.
Assessing neighborhood environment “Thinking about your neighborhood as a whole, how much of a problem do you feel each of the following is in your neighborhood?” [on a scale of 0 to 5, 0 is not a problem, 5 is a serious problem] • Too much traffic • Excessive noise • Trash and litter • Smells or odors from factories or farms • Smoke from fires or burning
neighborhood problems and physical functioning REF=0 SF-12 score difference * * adjusted for age, sex, income, education, ethnicity, & asthma severity Yen IH, et al. Am J Public Health 2006.
Part IV. Direct observation
Kaiser CYGNET Study - overview 444 7-year old girls Follow for 5 years through pubertal transition Collect information on diet, physical activity, height, and weight Live in Alameda, San Francisco, Marin, and Contra Costa Counties
Auxiliary study to CYGNET – neighborhood observations Select half of the 7-year old girls Send trained observer to girls’ neighborhood. Walk around to collect information about presence/absence of food stores, fast food, restaurants, recreation opportunities, and walkability/bikeability.
Preliminary results Collected street observation data for 213 girls Observed 3 to 32 street blocks per address; total of 2,301 street blocks Created combination variables for items in audit form, e.g. food stores, public services (e.g. library, post office), walkability/bikeability (e.g. sidewalks, cross walks, speed bumps) Used factor analysis to see how variables cluster together
Social context of pregnancy • 39-item survey representing four categories of neighborhood attributes: • neighborhood physical conditions; • social interactions; • nonresidential land use (commercial property); • public, residential and nonresidential space. Laraia BA, et al. Int J Health Geographics 2006.
Examples of items recorded Adult activity (Code all that apply) If no adults present ……………………… Walking …………………………………… Socializing (Talking with neighbors) …… Socializing in mixed racial groups ……… Home repair, landscaping, or car care … Sitting/standing on porch or stoop ……… Supervising children ……………………… Patronizing business establishments …… Standing on the sidewalk ………………… Sitting/standing at the bus stop ………… Getting into or out of vehicles …………… Walking a dog ……………………………. Conducting home-based vending ……… Recreational activity (e.g., jogging) …… Laraia BA, et al. Int J Health Geographics 2006.
Operationalizing neighborhood concepts – physical incivilities • combination of physical disorder and poor housing conditions • theorized to communicate decreased local social control and may contribute to crime and further neighborhood deterioration. • Items : • fences • hedges • Physical and symbolic signs that demarcate residential property
Operationalizing neighborhood concepts – territoriality • Ownership and social control leading to protective effects against crime and other adverse events • Items : • condition of housing, yards, commercial and public spaces, • vacant or burned property • litter and graffiti
Part V. Gis / spatial data
Stephen A. Matthews (Pennsylvania State University) - Multiple Activity Spaces (and Temporal Rhythms)
“Our Space” GIS database: UCSF, UC Berkeley, and Kaiser DOR • census data • retail store data (InfoUSA or Dunn &Bradstreet) • pollution • traffic • green space / parks