Download
1 / 1
10 likes | 163 Views
Model (Transfer Function). Output. Input. Uncertainty (Quantified). Uncertainty (Calculated). Uncertainty (Quantified). Modeling and Optimization of Vehicle Drivetrain Dynamic Performance Considering Uncertainty. Zissimos P. Mourelatos; Associate Professor

E N D
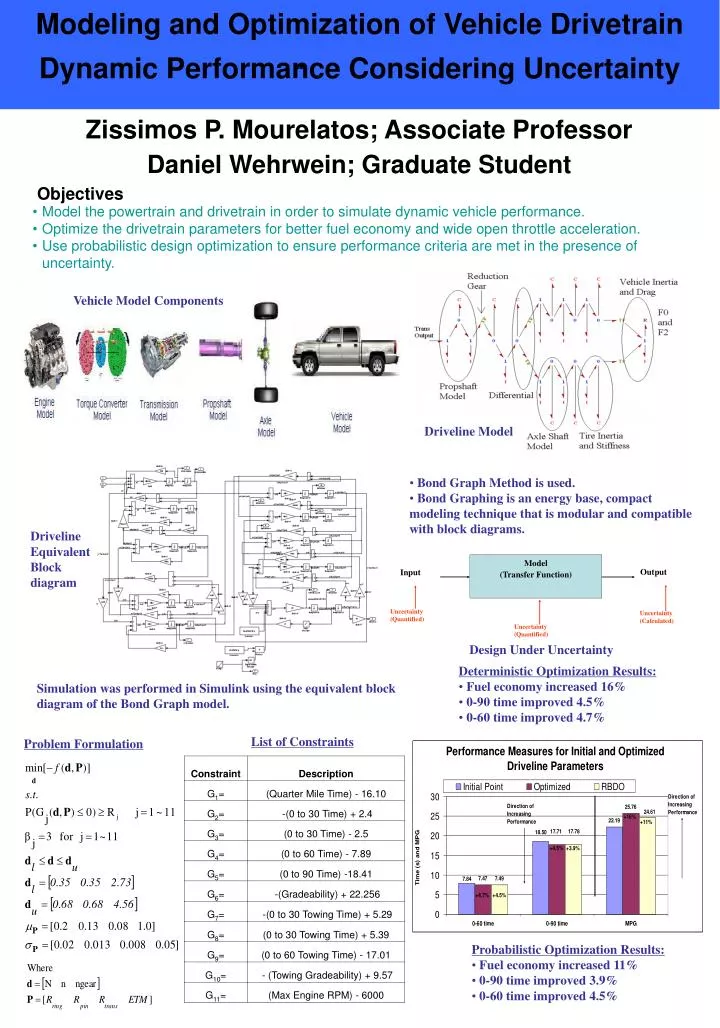
Model (Transfer Function) Output Input Uncertainty (Quantified) Uncertainty (Calculated) Uncertainty (Quantified) Modeling and Optimization of Vehicle Drivetrain Dynamic Performance Considering Uncertainty Zissimos P. Mourelatos; Associate Professor Daniel Wehrwein; Graduate Student Objectives • Model the powertrain and drivetrain in order to simulate dynamic vehicle performance. • Optimize the drivetrain parameters for better fuel economy and wide open throttle acceleration. • Use probabilistic design optimization to ensure performance criteria are met in the presence of uncertainty. Vehicle Model Components Driveline Model • Bond Graph Method is used. • Bond Graphing is an energy base, compact modeling technique that is modular and compatible with block diagrams. Driveline Equivalent Block diagram Design Under Uncertainty • Deterministic Optimization Results: • Fuel economy increased 16% • 0-90 time improved 4.5% • 0-60 time improved 4.7% Simulation was performed in Simulink using the equivalent block diagram of the Bond Graph model. List of Constraints Problem Formulation • Probabilistic Optimization Results: • Fuel economy increased 11% • 0-90 time improved 3.9% • 0-60 time improved 4.5% 2. Possibility-based optimization design