Download
1 / 17
170 likes | 271 Views
Using Deliberate Practice and Mathematica Demonstrations for teaching Quantitative Psychology. Bonnie A. Green, Ph.D. Psychology Department College of Arts and Science East Stroudsburg University. Sought out way to visualize statistics. Looking for something I could use in class

E N D
Using Deliberate Practice and Mathematica Demonstrations for teaching Quantitative Psychology Bonnie A. Green, Ph.D. Psychology Department College of Arts and Science East Stroudsburg University
Sought out way to visualize statistics • Looking for something I could use in class • The students could use outside of class • Learned about Mathematica from a Math Professor • Tried it in the class … it failed • Tried it again … it worked • Will review • How to use Mathematica Demonstrations • What increased students’ participation
Mathematica • Software from Wolfram Research, Inc. • Mathematica • Powerful symbolic algebra system • Illustrate mathematical concepts • Could purchase a copy of Mathematica, invest hours learning it, and develop illustrations to use in your classes • Or …
Mathematica Demonstrations • You could visit www.demonstrations.wolfram.com and access the illustrations for free! • Over 450 peer reviewed demonstrations on statistics • To use the demonstrations: • Download a plug-in for your browser Free Mathematica player • Click on the demonstration you plan to run • Download will run demonstrations right from your browser • Manipulate the parameters and see how it impacts the statistics Carducci (2011). Using Mathematica Demonstrations to Visualize Statistical Concepts. Retrieved from http://statisticalsage.wordpress.com/2011/05/24/using-mathematica-deomnstrations-to-visualize-statistical-concepts/
Normal Distribution Demonstrations • Students get to input mu and sigma • The Normal Distribution • Shows the area under the curve (i.e., you can manipulate the z-score) • Area Of A Normal Distribution
Sampling Distribution of the Means Demonstrations • Students can see the impact of changing mu, sigma, or sample size on its shape • Sampling Distribution Of The Sample Mean • How can we talk about the Sampling Distribution of the Means without mentioning the Central Limit Theorem? • The Central Limit Theorem
Confidence Interval Demonstrations • The writer of this Mathematica code did not include how variability (i.e., standard deviation) impacts the size of the “margin of error.” • Students get to change confidence level and sample size • Confidence Intervals Confidence Level Sample Size And Margin Of Error • How Do Confidence Intervals Work? • Though not as clean looking at the one above, this demonstration also includes the size of the standard deviation. • Confidence Interval Exploration
Hypothesis Testing Demonstrations • The effects of the sample size and population variance on hypothesis testing with the t-test • Hypothesis Tests about a Population Mean • How changes in the variables impact correlation’s (depending on how they are calculated) • Correlation And Regression Explorer • Can see the impact of correlation, sample size, and probability on regression • Influential Points in Regression
Power Demonstrations • Though I can get students to define power, and identify threats to power, I am never fully certain that they truly get the beauty (and hassle) of power. This demonstration may help. • Power
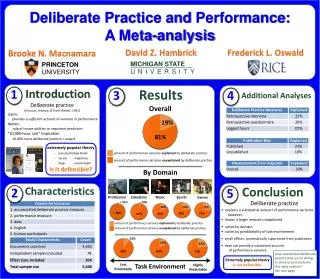
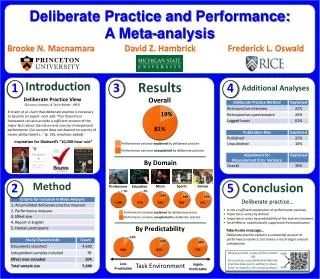
Deliberate Practice as a Pedagogical Tool • As a pedagogical tool, Deliberate Practice is in its infancy • Based off of the cognitive developmental research of Ericcson on expertise Ericcson's Deliberate Practice • Early 1990′s Ericcson and others noticed • People who became experts devoted a decades worth of time and effort • Ericcson hypothesized that through deliberate practice we could become experts • Not all practice is deliberate • For practice to be considered deliberate it seems that it requires the following:
Step #1 of Deliberate Practice 1. Specify the purpose • Establish desired goal • Make sure that it is something for which you are driven
Step #2 of Deliberate Practice 2. Establish means of reaching goal • Include specific steps • Identify • Where • When • How • With whom
Step #3 of Deliberate Practice 3. Established goal must take us to a higher level of attainment. • Is it attainable? • Will it cause you to develop and grow?
Step #4 of Deliberate Practice 4. Must formally and informally evaluate your progress • Must have: • Keen sense of your own metacognition and progress • Clear and honest sense of what you are doing, why you are doing it and how you can do it • Involve others in your assessment • Make sure to use the information to make modifications to your plan
Step #5 of Deliberate Practice 5. Practice! Practice! Practice! • Practice alone does not make perfect • Must have a detailed and well thought out plan • Practice must take you to higher level • Can be evaluated by both yourself and an expert • Mere repetition will not automatically lead to improvement!
The Addition of Deliberate Practice • By walking students through deliberate practice during class time • Establishing the goal of the class, the steps, the assessment • Went from 27% of students opening up the Mathematica links to 87%
For more information … • Visit statisticalsage.wordpress.com • Contact Bonnie at bgreen@esu.edu