Download

1 / 14
140 likes | 270 Views
UNCERTAINTY IN THE TOTAL OZONE DATA: IMPLICATIONS FOR UV RECONSTRUCTIONS. Janusz W. Krzyścin Institute of Geophysics Polish Academy of Sciences MCM X COST 726 ; EL ARENOSILLO, SPAIN , 1 0 -1 1 .0 4 .2008. TOTAL OZONE MEASUREMENTS GROUND-BASED SPECTROPHOTOMETERS

E N D
UNCERTAINTY IN THE TOTAL OZONE DATA: IMPLICATIONS FOR UV RECONSTRUCTIONS Janusz W. Krzyścin Institute of Geophysics Polish Academy of Sciences MCM X COST 726;EL ARENOSILLO, SPAIN , 10-11.04.2008
TOTAL OZONE MEASUREMENTS GROUND-BASED SPECTROPHOTOMETERS DOBSON (AROSA - 1926), BREWER ( ITALY-1986), FILTER INSTRUMENT (M83/M124, RUSSIA ~ 1970)
TOTAL OZONE MEASUREMENTS SATELLITE- BORNE SPECTROPHOTOMETERS TOMS : (since October 1978) NIMBUS 7 - 1978-1993 METEOR 3 – 1991-1994 Earth Probe – 1996-2005 SBUV : (operational monitoring since 1985) NOAA-9, 11, 14, and 16 TOVS: (operational monitoring 1995-2005) NOAA satelitte GOME: (1995 - present) – ERS-2 platform SCIAMACHY: (2002 - present) – ENVISAT platform OMI: (2004 – present) -AURA platform Nimbus 7 Platform
SELECTED TOTAL OZONE DATA BASES NIWA - GLOBAL TOTAL OZONE DATA 1978-2004: National Institute of Water and Atmosphere Research (NIWA), Lauder, New Zealand, Assimilated Total Ozone Data Base 1979-2004(Bodeker et al., 2005) Version 8 Nimbus 7 and Earth Probe TOMS GOME version 3.1 KNMI TOGOMI Version 8 SBUV from NIMBUS 7, NOAA9, NOAA 11, and NOAA 16 ERA- 40 (1958-2002)- GLOBAL DATA 3-D GCM SIMULATIONS COST-726 : (1950-2004) EUROPE DATA STATISTCAL MODEL TRAINED ON NIWA DATA IN BSCW DATA : COST MODEL DATA 1950-2004: NIWA DATA 1979-2004 MCM DECISION IN 2006 - USE THE BEST AVAILABLE DATA SOFTWARE (READY TO BE ADDED) CALCULATES O3 SERIES FOR ANY SITE IN THE AREA 1950-1978 - MODEL + 1979-2004 – NIWA + 1979-2004 (HOLES - NO NIWA) - MODEL
COST-726 DATA BASE The area with reconstructed daily total ozone values for the period 1950-2004 and ground-based stations used for the validation of the model. Grid resolution: Δφ=1°, Δλ=1.25° (IGFPAS) Δφ=1°, Δλ=1° (BSCW) DeBilt ● ● HK HOW LARGE ARE DIFFERENCES BETWEEN VARIOUS OZONE DATA? HK- Hradec Kralove - Dobson\Brewer mark III and IV\Satelitte\COST 726 DeBilt – (large differences?-Peter den Outer) – Brewer mark III\Satelitte\COST726
HRADEC KRALOVE DAILY TOTAL OZONE (BREWER_III – BREWER_IV) / BREWER_IV *100% 2004-2008 OCTOBER-MARCH APRIL - SEPTEMBER MEAN RELATIVE DEV.= -0.02% ± 1.42% MEAN RELATIVE DEV.= 0.23% ± 1.03%
HRADEC KRALOVE DAILY TOTAL OZONE (BREWER_IV – DOBSON) / DOBSON*100% 1994-2008 OCTOBER - MARCH OCTOBER-APRIL APRIL - SEPTEMBER MEAN RELATIVE DEV.= 0.00% ± 1.97% MEAN RELATIVE DEV.= 1.32% ± 2.64%
HRADEC KRALOVE DAILY TOTAL OZONE (COST – DOBSON) / DOBSON*100% 1979-2004 APRIL - SEPTEMBER OCTOBER - MARCH MEAN RELATIVE DEV.= -0.35% ± 3.05% MEAN RELATIVE DEV.= -0.79% ± 3.77%
HRADEC KRALOVE DAILY TOTAL OZONE (COST – DOBSON) / DOBSON*100% 1961-1978 OCTOBER - MARCH APRIL - SEPTEMBER MEAN RELATIVE DEV.= -1.66% ± 4.47% MEAN RELATIVE DEV.= -0.77% ± 6.71%
DeBilt DAILY TOTAL OZONE (SATELITTE – BREWER III ) / BREWER III *100% 1996-2008 OCTOBER - MARCH APRIL - SEPTEMBER MEAN RELATIVE DEV.= 0.01% ± 2.96% MEAN RELATIVE DEV.= -1.96% ± 3.34%
DeBilt DAILY TOTAL OZONE (COST – SATELITTE )/ SATELITTE *100% 1979-2004 OCTOBER - MARCH APRIL - SEPTEMBER Nimbus 7 Earth Probe Nimbus 7 Earth Probe MEAN RELATIVE DEV.= -0.38% ± 1.66% MEAN RELATIVE DEV.= -0.54% ± 2.02%
General Comments HOW TO CALCULATE THE TRUE TOTAL OZONE VALUE? *LONG-TERM BIAS BETWEEN VARIOUS OZONE SOURCES WITHIN ±2% RANGE *STANDARD DEVIATION OF THE SATELLITE/GROUND O3 AND COST/GROUND O3 DAILY DIFFERENCES 2-5% (APRIL-SEPTEMBER) ~2-3% STANDARD DEVIATION FOR THE SATELITTE ERA T>1979 ~5% STANDARD DEVIATION FOR THE PRE-SATELLITE ERA *FOR RECONSTRUCTION OF UV USE: COST O3 BASE BEFORE 1979 REGRIDDED NIWA BASE (WITH HOLES FILLED BY COST MODEL) AFTER 1978 *BSCW DATA CONTAINS: BOTH DATA SOURCES (COST726-NEW, NIWA-NEW) PROCEDURE TO CALCULATE TIME SERIES FOR ANY SITE IN EUROPE (USER SELECTS ONLY φ AND λ ) - FORTRAN 77 SOURCE + .EXE VERSION READY – TO BE COPIED SOON - TIME SERIES 1950-2004 FOR HRADEC KRALOVE AND DEBILT - TO BE COPIED SOON *TECHNICAL COMMENT: CHECK CORRECTNESS OF YOUR OZONE READING PROCEDURE USING THESE TIME SERIES!
FINAL COMMENTS The extreme difference between the modelled and measured daily total ozone is ~ 20% that induces ~ 20% overestimation or underestimation of UV erythemally weighted radiation reaching the ground-level under clear-sky conditions. The total ozone data base is proper for examination of long-term variability( IΔO3 l > 2% ) rather than for analyses of extreme ozone cases. All statistics concerning UV radiation should be built by averaging modelled daily UV data. Monthly mean UV doses seem to be unreliable if inferred from the monthly mean ozone and monthly mean cloudiness. Various comparisons with the ground-based and satellite data lead to conclusion that the statistical total ozone data base over Europe will provide valuable input values for the surface UV reconstructions there.
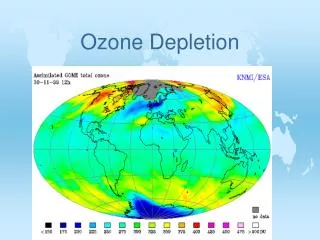
SATELLITE DATA AVERAGED OVER CENTRAL EUROPE DAILY MEANS MONTHLY MEANS UNEXPECTED OZONE BEHAVIOUR – OZONE IS DECRESING!