Download
1 / 75
780 likes | 1.64k Views
RooFit/RooStats Tutorial CAT Meeting, June 2009. Presented by: Max Baak Thanks to: Wouter Verkerke, Kyle Cranmer for examples!. Structure of RooFit/RooStats tutorial. A tutorial in two sessions. Part one (Monday, 10h30): Introduction to RooFit Entry-level exercises Aimed for beginners

E N D
RooFit/RooStats TutorialCAT Meeting, June 2009 Presented by: Max Baak Thanks to: Wouter Verkerke,Kyle Cranmer for examples!
Structure of RooFit/RooStats tutorial A tutorial in two sessions. • Part one (Monday, 10h30): • Introduction to RooFit • Entry-level exercises • Aimed for beginners • Part two (Friday, 10h00): • Introduction to RooStats (statistics extension to RooFit) • (Selection of) Advanced and new features of RooFit • Also useful for experienced users
RooFit: Your toolkit for data modeling What is RooFit? • A powerful toolkit for modeling and fitting the expected distribution(s) of events in a physics analysis • Very easy to setup large-scale fit in structured, transparent fashion. • Primarily targeted to high-energy physicists using ROOT • But, even used in financial world. • Originally developed for the BaBar collaboration by Wouter Verkerke and David Kirkby, back in year 2000. • Wouter is main developer • Included with ROOT since v5.xx • Core code is very mature, stable • Continuous development, addition of more-powerful features. • Standard in CMS!
Documentation Main sources of documentation: • http://root.cern.ch/drupal/content/users-guide • See for RooFit documentation (150+ pages) • $ROOTSYS/tutorials/roofit/ • See for example macros • http://root.cern.ch/root/Reference.html • See for (latest) class descriptions. RooFit classes start with “Roo”. • RooFit code itself is structured and well documented! • http://root.cern.ch/root/roottalk/roottalk09/ • Browse though RootTalk • Bug Wouter Verkerke directly
Implementation – Add-on package to ROOT Shared library: libRooFit.so Data Modeling ToyMC dataGeneration Model Visualization Data/Model Fitting MINUIT C++ command line interface & macros Data management & histogramming I/O support Graphics interface
• Probability Density FunctionF(x; p, q) • Physical parameters of interest p • Other parameters q to describe detector effect (resolution,efficiency,…) • Normalized over allowed range of the observables x w.r.t the parameters p and q RooFit purpose - Data Modeling for Physics Analysis Distribution of observables x Define data model Fit model to data Determination of p,q
Data modeling - Desired functionality • Building/Adjusting Models • Easy to write basic PDFs ( normalization) • Easy to compose complex models (modular design) • Reuse of existing functions • Flexibility – No arbitrary implementation-related restrictions A n a l y s i s c y c l e • Using Models • Fitting : Binned/Unbinned (extended) MLL fits, Chi2 fits • Toy MC generation: Generate MC datasets from any model • Visualization: Slice/project model & data in any possible way • Speed – Should be as fast or faster than hand-coded model
Data modeling – OO representation • Mathematical objects are represented as C++ objects Mathematical concept RooFit class variable RooRealVar function RooAbsReal PDF RooAbsPdf space point RooArgSet integral RooRealIntegral list of space points RooAbsData
Model building – (Re)using standard components • RooFit provides a collection of compiled standard PDF classes RooBMixDecay Physics inspired ARGUS,Crystal Ball, Breit-Wigner, Voigtian,B/D-Decay,…. RooPolynomial RooHistPdf Non-parametric Histogram, KEYS RooArgusBG RooGaussian Basic Gaussian, Exponential, Polynomial,… • PDF Normalization • By default RooFit uses numeric integration to achieve normalization • Classes can optionally provide (partial) analytical integrals • Final normalization can be hybrid numeric/analytic form
Model building – (Re)using standard components • Most physics models can be composed from ‘basic’ shapes RooBMixDecay RooPolynomial RooHistPdf RooArgusBG RooGaussian + RooAddPdf
Model building – (Re)using standard components • Most physics models can be composed from ‘basic’ shapes RooBMixDecay RooPolynomial RooHistPdf RooArgusBG RooGaussian * RooProdPdf
Model building – (Re)using standard components • Building blocks are flexible • Function variables can be functions themselves • Just plug in anything you like • Universally supported by core code (PDF classes don’t need to implement special handling) m(y;a0,a1) g(x;m,s) g(x,y;a0,a1,s) RooPolyVar m(“m”,y,RooArgList(a0,a1)) ; RooGaussian g(“g”,”gauss”,x,m,s) ;
Model building – Expression based components • RooFormulaVar – Interpreted real-valued function • Based on ROOT TFormula class • Ideal for modifying parameterization of existing compiled PDFs • RooGenericPdf – Interpreted PDF • Based on ROOT TFormula class • User expression doesn’t need to be normalized • Maximum flexibility RooBMixDecay(t,tau,w,…) RooFormulaVar w(“w”,”1-2*D”,D) ; RooGenericPdf f("f","1+sin(0.5*x)+abs(exp(0.1*x)*cos(-1*x))",x)
Using models – Fitting options • Fitting interface is flexible and powerful, many options supported • Data type • Binned • Unbinned • Weighted unbinned Sample interactive MINUIT session RooNLLVar nll(“nll”,”nll”,pdf,data) ; RooMinuit m(nll) ; m.hesse() ; x.setConstant() ; y.setVal(5) ; m.migrad() ; m.minos() RooFitResult* r = m.save() ; Access any of MINUITsminimization methods • Goodness-of-fit measure • -log(Likelihood) • Extended –log(L) • Chi2 • User Defined • (add custom/penalty terms to any of these) Change and fix param. values,using native RooFit interface during fit session • Output • Modifies parameter objects of PDF • Save snapshot of initial/final parameters, correlation matrix, fit status etc… • Interface • One-line: RooAbsPdf::fitTo(…) • Interactive: RooMinuit class
Using models – Fitting speed & optimizations • RooFit delivers per-fit tailored optimization without user overhead! • Benefit of function optimization traditionally a trade-off between • Execution speed (especially in fitting) • Flexibility/maintainability of analysis user code • Optimizations usually hard-code assumptions… • Evaluation of –log(L) in fits lends it well to optimizations • Constant fit parameters often lead to higher-level constant PDF components • PDF normalization integrals have identical value for all data points • Repetitive nature of calculation ideally suited for parallelization. • RooFit automates analysis and implementation of optimization • Modular OO structure of PDF expressions facilitate automated introspection • Find and pre-calculate highest level constant terms in composite PDFs • Apply caching and lazy evaluation for PDF normalization integrals • Optional automatic parallelization of fit on multi-CPU hosts • Optimization concepts are applied consistently and completely to all PDFs • Speedup of factor 3-10typical in realistic complex fits
Using models – Plotting • RooPlot – View of 1 datasets/PDFs projected on the same dimension Create the view on mes RooPlot* frame = mes.frame() ; Project the data on the mes view data->plotOn(frame) ; Project the PDF on the mes view pdf->plotOn(frame) ; Project the bkg. PDF component pdf->plotOn(frame,Components(“bkg”)) Draw the view on a canvas frame->Draw() ; Axis labels auto-generated
Using models - Overview • All RooFit models provide universal and completefitting and Toy Monte Carlo generating functionality • Model complexity only limited by available memory and CPU power • models with >16000 components, >1000 fixed parametersand>80 floating parameters have been used (published physics result) • Very easy to use – Most operations are one-liners Fitting Generating data = gauss.generate(x,1000) RooAbsPdf gauss.fitTo(data) RooDataSet RooAbsData
Advanced features – Task automation • Support for routine task automation, e.g. goodness-of-fit study Accumulate fit statistics Input model Generate toy MC Fit model Distribution of - parameter values - parameter errors - parameter pulls Repeat N times // Instantiate MC study manager RooMCStudy mgr(inputModel) ; // Generate and fit 100 samples of 1000 events mgr.generateAndFit(100,1000) ; // Plot distribution of sigma parameter mgr.plotParam(sigma)->Draw()
RooStats What is RooStats? • Set of statistical tools on top of RooFit (& ROOT). • Joint, open project between LHC experiments and ROOT. • Code is developing quickly. Goals • Enable the combining of results of multiple measurements/experiments, including syst. uncertainties. • Standard in CMS! • Various tools to determine sensitivity and limits. • Techniques ranging from Bayesian to fully Frequentist.
RooStats documentation • http://twiki.cern.ch/twiki/bin/view/RooStats/ • Mailing list: roostats-development@cern.ch
Combination of measurements: An Example • Example shows opening (fake) Atlas and CMS measurements, and performing a combined fit to a common parameter with a profile likelihood. (thanks to Kyle Cranmer)
Appetizer for first part of tutorial Featuring: • The basic RooFit toolkit • Convolutions of functions • Calculate the P-value of your model. • Modelling the top mass spectrum • A combined fit to signal and control samples • Unbinned efficiency curve fit • And much more!
RooFit users tutorial The basics Probability density functions & likelihoods The basics of OO data modeling The essential ingredients: PDFs, datasets, functions
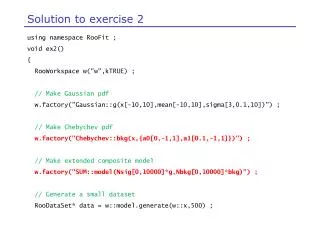
Outline of the hands-on part • Guide you through the fundamentals of RooFit • Look at some sample composite data models • Still quite simple, all 1-dimensional • Try to do at least one ‘advanced topic’, preferably more • Tutorial 8: Calculating the P-value of your analysis.P-Value = How often does an equivalent data sample with no signal mimic the signal you observe • Tutorial 9: Fit to a top mass distribution • Tutorial 10: Simultaneous fit to signal and control samples • Copy roofit_tutorial.tar.gz from ~mbaak/public/ • Untar roofit_tutorial.tar in your favorite directory on lxplus • Contents of the tutorial setup tutorial/setup.sh tutorial/docs/roofit_tutorial.ppt tutorial/macros http://root.cern.ch/root/html/ClassIndex.html Source this setup script first! This presentation Macros to be used in this tutorial Open in your favorite browser
Loading RooFit into ROOT • >source setup.sh (in the tutorial/ directory) • Make sure libRooFit.so is in $ROOTSYS/lib • Start ROOT • In the ROOT command line load the RooFit library • Normally, this happens automatically. gSystem->Load(“libRooFit”) ;
Creating a variable – class RooRealVar • Creating a variable object • Every RooFit objects must have a unique name! RooRealVar mass(“mass”,“m(e+e-)”,0,1000) ; C++ name Name Title Allowed range
Creating a probability density function • First create the variables you need • Then create a function object • Give variables as arguments to link variables to a function Try these commands in an interactive root session. Allowed range RooRealVar x(“x”,“x observable”,-10,10) ; RooRealVar mean(“mean”,“mean”,0.0,-10,10) ; RooRealVar width(“width”,“width”,3.0,0.1,10.) ; Allowed range Initial value RooGaussian gauss(“gauss”,”Gaussian”,x, mean,width) ; Continue typing commands till slide 34 …
Making a plot of a function • First create an empty plot • A frame is a plot associated with a RooFit variable • Draw the empty plot on a ROOT canvas RooPlot* frame = x.frame() ; frame->Draw() Plot range taken from limits of x
Making a plot of a function (continued) • Draw the (probability density) function in the frame • Update the frame in the ROOT canvas gauss.plotOn(frame) ; frame->Draw() Axis label from gauss title Unit normalization
Interacting with objects • Changing and inspecting variables • Draw another copy of gauss width.getVal() ; (const Double_t) 3.00 width = 1.0 ; width.getVal() ; (const Double_t) 1.00 gauss.plotOn(frame) ; frame->Draw() macro/tut0.C
Inspecting composite objects • Inspecting the structure of gauss • Inspecting the contents of frame gauss.printCompactTree() ; 0x10b95fc0 RooGaussian::gauss (gauss) [Auto] 0x10b90c78 RooRealVar::x (x) 0x10b916f8 RooRealVar::mean (mean) 0x10b85f08 RooRealVar::width (width) frame->Print(“v”) RooPlot::frame(10ba6830): "A RooPlot of "x"" Plotting RooRealVar::x: "x" Plot contains 2 object(s) (Options="L") RooCurve::curve_gaussProjected: "Projection of gauss" (Options="L") RooCurve::curve_gaussProjected: "Projection of gauss"
Data • Unbinned data is represented by a RooDataSet object • Class RooDataSet is RooFit interface to ROOT class TTree RooDataSet RooRealVar y RooDataSet associatesa RooRealVar withcolumn of a TTree Association by matching TTree Branch name with RooRealVar name RooRealVar x TTree
Creating a dataset from a TTree • First open file with TTree • Create RooDataSet from tree macros/tut1.root TFile f(“tut1.root”) ; f.ls() ; root [1] .ls TFile** tut1.root TFile* tut1.root KEY: TTree xtree;1 xtree xtree->Print() ; RooDataSet data(“data”,”data”,xtree,x) ; Imported TTree RooFit Variable in dataset
Drawing a dataset on a frame • Create new plot frame, draw RooDataSet on frame, draw frame RooPlot* frame2 = x.frame() ; data.plotOn(frame2) ; frame2->Draw() ; Note Poisson Error bars
Overlaying a PDF curve on a dataset • Add PDF curve to frame gauss.plotOn(frame2) ; frame2->Draw() ; Unit normalizedPDF automatically scaled to dataset But shape is not right! Lets fit the curve to the data
Fitting a PDF to an unbinned dataset • Fit gauss to data • Behind the scenes • RooFit constructs the Likelihood from the PDF and the dataset • RooFit passes the Likelihood function to MINUIT to minimize • RooFit extracts the result from MINUIT and stores in the RooRealVar objects that represent the fit parameters • Draw the result gauss.fitTo(data) ; gauss.plotOn(frame2) ; frame2->Draw() ;
Looking at the fit results • Look again at the PDF variables • Results from MINUIT back-propagated to variables width.Print() ; RooRealVar::sigma: 1.9376 +/- 0.043331 (-0.042646, 0.044033) L(-10 – 10) mean.Print() ; RooRealVar::mean: -0.0843265 +/- 0.061273 (-0.061210, 0.061361) L(-10 - 10) Adjusted value Symmetricerror (from HESSE) Asymmetricerror (from MINOS, not shownby default)
Putting it all together • A self contained example to construct a model, fit it, and plot it on top of the data void fit(TTree* dataTree) { // Define model RooRealVar x(“x”,”x”,-10,10) ; RooRealVar sigma(“sigma”,”sigma”,2,0.1,10) ; RooRealVar mean(“mean”,”mean”,-10,10) ; RooGaussian gauss(“gauss”,”gauss”,x,mean,sigma) ; // Import data RooDataSet data(“data”,”data”,dataTree,x) ; // Fit data gauss.fitTo(data) ; // Make plot RooPlot* frame = x.frame() ; data.plotOn(frame) ; gauss.plotOn(frame) ; frame->Draw() ; } macro/tut1.C See next slidefor instructions
Putting it all together • A self contained example to construct a model, fit it, and plot it on top of the dataset. macro/tut1.C root [0] TFile f("tut1.root") root [1] .L tut1.C root [2] fit(xtree) In macro/tut1.C uncomment two lines below // Make plot and see what happens (From hereon you can modify the macros directly yourself.) gauss.fitTo(data,Minos()); gauss.fitTo(data,Hesse()); // default // (See RooMinuit.cxx for// all possible fit options) Edit the macro to switch between Hesse and Minos minimization.
Building composite PDFS • RooFit has a collection of many basic PDFs. RooArgusBG - Argus background shape RooBifurGauss - Bifurcated Gaussian RooBreitWigner - Breit-Wigner shape RooCBShape - Crystal Ball function RooChebychev - Chebychev polynomial RooDecay - Simple decay function RooExponential - Exponential function RooGaussian - Gaussian function RooKeysPdf - Non-parametric data description RooPolynomial - Generic polynomial PDF RooVoigtian - Breit-Wigner (X) Gaussian HTML class documentation in: http://root.cern.ch/root/html/ROOFIT_ROOFIT_Index.html
Building realistic models • You can combine any number of the preceding PDFs to build more realistic models macro/tut2.C RooRealVar x(“x”,”x”,-10,10) // Construct background model RooRealVar alpha(“alpha”,”alpha”,-0.3,-3,0) ; RooExponential bkg(“bkg”,”bkg”,x, alpha) ; // Construct signal model RooRealVar mean(“mean”,”mean”,3,-10,10) ; RooRealVar sigma(“sigma”,”sigma”,1,0.1,10) ; RooGaussian sig(“sig”,”sig”,x,mean,sigma) ; // Construct signal+background model RooRealVar sigFrac(“sigFrac”,”signal fraction”,0.1,0,1) ; RooAddPdf model(“model”,”model”,RooArgList(sig,bkg),sigFrac) ; // Plot model RooPlot* frame = x.frame() ; model.plotOn(frame) ; model.plotOn(frame,Components(bkg),LineStyle(kDashed)) ; frame->Draw() ;
Sampling ‘toy’ Monte Carlo events from model • Just like you can fit models, you can also sample ‘toy’ Monte Carlo events from models RooDataSet* mcdata = model.generate(x,1000) ; RooPlot* frame2 = x.frame() ; mcdata->plotOn(frame2) ; model->plotOn(frame2) ; frame2->Draw() ; Try this yourself ...
RooAddPdf can add any number of models RooRealVar x("x","x",0,10) ; // Construct background model RooRealVar alpha("alpha","alpha",-0.7,-3,0) ; RooExponential bkg1("bkg1","bkg1",x,alpha) ; // Construct additional background model RooRealVar bkgmean("bkgmean","bkgmean",7,-10,10) ; RooRealVar bkgsigma("bkgsigma","bkgsigma",2,0.1,10) ; RooGaussian bkg2("bkg2","bkg2",x,bkgmean,bkgsigma) ; // Construct signal model RooRealVar mean("mean","mean",3,-10,10) ; RooRealVar width("width","width",0.5,0.1,10) ; RooBreitWigner sig("sig","sig",x,mean,width) ; // Construct signal+2xbackground model RooRealVar bkg1Frac("bkg1Frac","signal fraction",0.2,0,1) ; RooRealVar sigFrac("sigFrac","signal fraction",0.5,0,1) ; RooAddPdf model("model","model",RooArgList(sig,bkg1,bkg2), RooArgList(sigFrac,bkg1Frac)) ; RooPlot* frame = x.frame() ; model.plotOn(frame) ; model.plotOn(frame,Components(RooArgSet(bkg1,bkg2)),LineStyle(kDashed)) ; frame->Draw() ; macros/tut3.C
RooAddPdf can add any number of models Try adding another signal term
Extended Likelihood fits • Regular likelihood fits only fit for shape • Number of coefficients in RooAddPdf is always one less than number of components • Can also do extended likelihood fit • Fit for both shape and observed number of events • Accomplished by adding ‘extended likelihood term’ to regular LL • Extended term automatically constructed in RooAddPdf if given equal number of coefficients & PDFS
Extended Likelihood fits and RooAddPdf • How to construct an extended PDF with RooAddPdf • Fitting with extended model // Construct extended signal+2xbackground model RooRealVar nbkg1(“nbkg1",“number of bkg1 events",300,0,1000) ; RooRealVar nbkg2(“nbkg2",“number of bkg2 events",200,0,1000) ; RooRealVar nsig( “nsig",“number of signal events",500,0,1000) ; RooAddPdf emodel(“emodel",“emodel",RooArgList(sig, bkg1, bkg2), RooArgList(nsig,nbkg1,nbkg2)) ; Add extended term sigFrac bkg1Frac ntotal New representation nsig nbkg1 nbkg2 Previous model sigFrac bkg1Frac macros/tut4.C emodel.fitTo(data,”e”) ; Look at sum, expected errors, and correlations between fitted event numbers Include extended term in fit
Switching gears • Hands-on exercise so far designed to introduce you to basic model building syntax • Real power of RooFit is in using those models to explore your analysis in an efficient way • No time in this short session to cover this properly, so next slide just gives you a flavor of what is possible • Multidimensional models, selecting by likelihood ratio • Demo on ‘task automation’ as mentioned in last slide of introductory slide
Multi-dimensional PDFs • RooFit handles multi-dimensional PDFs as easily as 1D PDFs • Just use class RooProdPdf to multiply 1D PDFS • Case example: selecting B+ D0 K+ • Three discriminating variables: mES, DeltaE, m(D0) • Look at example model, fit, plots in * * Signal Model * * Background Model macros/tut5.C Run example model, fit, plots in:
Selecting by Likelihood ratio • Plain projection of multi-dimensional PDF and dataset often don’t do justice to analyzing power of PDF • You don’t see selecting power of PDF in dimensions that are projected out • Possible solution: don’t plot all events, but show only events passing cut of signal,bkg likelihood ratios constructed from PDF dimensions that are not shown in the plot Plain projection of mESof previous excercise Result from 3D fit Nsig = 91 ± 10 Close to sqrt(N) macros/tut6.C