Download
1 / 33
330 likes | 470 Views
Forecasting Traffic Impacts for Work Zone Transportation Management Plans. TRB Planning Applications Conference June 4, 2019. Problem Statement. Work zone traffic impacts are addressed through Traffic Management Plans (TMP), a process recently updated to include modeling

E N D
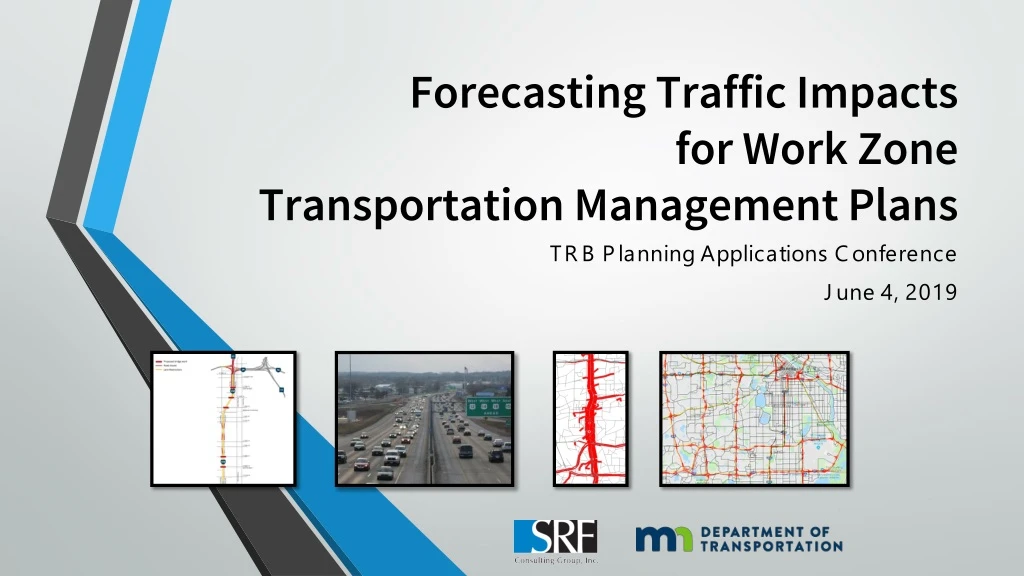
Forecasting Traffic Impactsfor Work Zone Transportation Management Plans TRB Planning Applications Conference June 4, 2019
Problem Statement • Work zone traffic impacts are addressed through Traffic Management Plans (TMP), a process recently updated to include modeling • Need to validate current modeling capabilities and determine appropriate level of effort
Context • Traditional four-step model recently replaced by activity-based model • DTA updated to spatially align with ABM – larger/more detailed coverage
Approach • Back-casting for two major construction projects • 35W@94: Downtown to Crosstown in Minneapolis • US 169 Nine Mile Creek Bridge Replacement • Use of StreetLight Data and MnDOT loop detectors for ground truth data
Slide Symbols Street Light LOOP ABM DTA StreetLight Data Loop Detector Counts Regional travel demand model (ABM) Dynamic Traffic Assignment (DTA) model
35W@94: Downtown to Crosstown • I-35W from I-94 to 43rd St • Summer 2017 to Fall 2021 • Partnership • MnDOT • Metro Transit • Hennepin County • City of Minneapolis • Major transit corridor • Over 500 daily bus trips • 14,000 daily rides
I-35W: Construction Scenarios • Timeline • Pre-construction period: April 2018 • Construction time period: October
35W ABM: Volume Delta map ABM Closed: TH 65 to Downtown and I-94 West I-35W Capacity Restrictions Blue – Volume Increase Orange – Volume Decrease
Where does the traffic go? ABM Baseline I-35W traffic Trips assigned with construction restrictions
Volume Delta : Freeways ABM Many locations have similar traffic diversion pattern (I-35W, I-94, TH 100) Magnitude of delta in work zone location similar to observed conditions Loop Detector ABM
Volume Delta : Arterials ABM Lower volume diversion on arterials versus DTA 27,500 Volume delta on arterials About 50% of diversion within 2.5 miles of I-35W Volume Delta
DTA: Local Streets DTA • High volume diversion on Stevens Ave • Volume Delta at: • Stevens Ave: +26,000 • Nicollet Ave: +12,000
Volume Delta : Freeways LOOP DTA 31 Locations Overestimation of volume delta at the work zone location Underestimation of volume delta on freeway system Possible chances of overestimation on lower functional class Loop Detector DTA
Volume Delta : Arterials DTA 52,500 positive volume delta on arterials close to the work zone Nearly 70% of diversion within 2.5 miles of I-35W Volume Delta
Arterials Volume Delta : ABM vs DTA DTA ABM Traffic diversion similar on Lyndale Ave, Cedar Ave, Hiawatha Low volume delta observed on Nicollet Ave Concern that DTA model does not adequately constrain capacity on local roadways DTA ABM
Streetlight Analysis : Arterial Street Light No up-to-date volume data on arterials available Streetlight O-D percentages were used to analyze traffic diversion on major parallel routes Reported values estimated by applying proportion of volume diversion to StreetLight percentages
Summary: 35W Construction Scenario DTA • Observation • DTA overestimates diversions to roadways closer to the work zone • Possible reasons • From previous analysis we know DTA directs more trips to local network • Recommendations • Additional customized “traffic flow models” could be developed for DTA • Addition of signal controls
US 169 Bridge Closure Bridge closed
Hwy 169 Construction Timeline Initial traffic control configuration Modified traffic control configuration Dovre Dr. Closure Start End 494 & 100 Constr. Sep 2017 Nov 2016 Jan 2017 Mar 2017 Data collection for pre-construction Data collection for during construction
US 169: Construction Scenarios Scenario 2 most closely resembles the actual construction condition
US 169 Construction Results ABM DTA
StreetLight Data Street Light • Assumptions for evaluation of Hwy 169 construction project • Pre-construction time period: Mid November – Mid December 2016 (excluding the Thanksgiving weekend) • Construction time period: April 2017 • Data only showing personal vehicles indexed volume* • The volume is for average weekday and the time period is entire day * Indexed volume does not indicate actual number of trips or vehicles on the road but can be used to understand travel patterns and percentages
Pre-construction NB Volume Using the Bridge Street Light NB: 50,000 Middle Filter Origin/Destination Passthrough Zone
Pre-construction NB Volume Using the Bridge Street Light 50% of NB traffic comes from 62 & 212 & Bren Rd 50% of NB traffic comes from 169 S of 62 Middle Filter Origin/Destination Passthrough Zone
Pre-construction NB Volume Using the Bridge Street Light Middle Filter 23% of NB traffic comes from 494 & Valley View Origin/Destination Passthrough Zone 27% of NB traffic comes from 169 S of 494
Pre-construction SB Volume Using the Bridge Street Light SB: 43,000 Middle Filter Origin/Destination Passthrough Zone
Pre-construction SB Volume Using the Bridge Street Light 40% of SB traffic comes from 169 N of 394 60% of SB traffic comes from 394, Hwy 7, Excelsior Blvd, 7th St, etc. Middle Filter Origin/Destination Passthrough Zone
Traffic Diversions During Construction 32% of traffic originally using the bridge to/from TH 169 south of I-494 diverted to TH 100. 35% of traffic originally using the bridge to/from TH 169 south of I-494 diverted to I-494. Middle Filter Origin/Destination Passthrough Zone Accounted Diversion Routes Other Diversion Routes
Summary of US 169 Evaluation DTA • Observation • DTA emphasizes diversions to roadways closer to the work zone area • Possible reasons and Recommendations • Signal controls are missing • More calibration is needed for DTA • Traffic flow models on freeways • Addition of signal controls • Use of other methods in DTA • Defining different user classes • Defining official detour routes Add some ABM findings
Findings & Recommendations • DTA model tends to divert traffic later in the trip as it gets closer to the work zone, resulting in higher diversion to immediately adjacent routes • ABM (static assignment) may require more severe speed/capacity reductions on work zone links to replicate diversion magnitude • Signal control in DTA could help to constrain traffic shifts to local arterials
Thank you!Questions? Minnesota Department of TransportationSRF Consulting Group, Inc. Jim Henricksen, AICP Paul Morris, PE Director of Travel Behavior Principal – Transportation Analytics jim.Henricksen@state.mn.uspmorris@srfconsulting.com 651-234-7782 763-452-4773